- Runzhong Wang, Shanghai Jiao Tong University, China
- Junchi Yan (corresponding author), Shanghai Jiao Tong University, China
- Xiaokang Yang, Shanghai Jiao Tong University, China
Combinatorial Learning of Robust Deep Graph Matching:an Embedding based Approach
This project page includes code & additional result on our ICCV & PAMI papers.
Abstract
Abstract
Graph matching aims to establish node correspondence between two graphs, which has been a fundamental problem for its NP-complete nature. One practical consideration is the effective modeling of the affinity function in the presence of noise, such that the mathematically optimal matching result is also physically meaningful. This paper resorts to deep neural networks to learn the node and edge feature, as well as the affinity model for graph matching in an end-to-end fashion. The learning is supervised by combinatorial permutation loss over nodes. Specifically, the parameters belong to convolutional neural networks for image feature extraction, graph neural networks for node embedding that convert the structural (beyond second-order) information into node-wise features that leads to a linear assignment problem, as well as the affinity kernel between two graphs. Our approach enjoys flexibility in that the permutation loss is agnostic to the number of nodes, and the embedding model is shared among nodes such that the network can deal with varying numbers of nodes for both training and inference. Moreover, our network is class-agnostic. Experimental results on extensive benchmarks show its state-of-the-art performance. It bears some generalization capability across categories and datasets, and is capable for robust matching against outliers.
Authors
Paper & code
Approach
Permutation loss and Intra-graph Affinity based Graph Matching (PIA-GM) and
Permutation loss and Cross-graph Affinity based Graph Matching (PCA-GM)
 Iterative Permutation loss and Cross-graph Affinity based Graph Matching (IPCA-GM)

Iterative Permutation loss and Cross-graph Affinity based Graph Matching (IPCA-GM)
Result
Experimental result on Pascal VOC Keypoint dataset without outliers:
| Method | aero | bike | bird | boat | bottle | bus | car | cat | chair | cow | table | dog | horse | mbike | person | plant | sheep | sofa | train | tv | mean |
|---|---|---|---|---|---|---|---|---|---|---|---|---|---|---|---|---|---|---|---|---|---|
| GMN | 31.9 | 47.2 | 51.9 | 40.8 | 68.7 | 72.2 | 53.6 | 52.8 | 34.6 | 48.6 | 72.3 | 47.7 | 54.8 | 51.0 | 38.6 | 75.1 | 49.5 | 45.0 | 83.0 | 86.3 | 55.3 |
| GMN-PL | 31.1 | 46.2 | 58.2 | 45.9 | 70.6 | 76.4 | 61.2 | 61.7 | 35.5 | 53.7 | 58.9 | 57.5 | 56.9 | 49.3 | 34.1 | 77.5 | 57.1 | 53.6 | 83.2 | 88.6 | 57.9 |
| PIA-GM | 41.5 | 55.8 | 60.9 | 51.9 | 75.0 | 75.8 | 59.6 | 65.2 | 33.3 | 65.9 | 62.8 | 62.7 | 67.7 | 62.1 | 42.9 | 80.2 | 64.3 | 59.5 | 82.7 | 90.1 | 63.0 |
| PCA-GM | 51.2 | 61.3 | 61.6 | 58.4 | 78.8 | 73.9 | 68.5 | 71.1 | 40.1 | 63.3 | 45.1 | 64.4 | 66.4 | 62.2 | 45.1 | 79.1 | 68.4 | 60.0 | 80.3 | 91.9 | 64.6 |
| IPCA-GM | 51.0 | 64.9 | 68.4 | 60.5 | 80.2 | 74.7 | 71.0 | 73.5 | 42.2 | 68.5 | 48.9 | 69.3 | 67.6 | 64.8 | 48.6 | 84.2 | 69.8 | 62.0 | 79.3 | 89.3 | 66.9 |
Experimental result on Pascal VOC Keypoint dataset with outliers:
| Method | aero | bike | bird | boat | bottle | bus | car | cat | chair | cow | table | dog | horse | mbike | person | plant | sheep | sofa | train | tv | mean |
|---|---|---|---|---|---|---|---|---|---|---|---|---|---|---|---|---|---|---|---|---|---|
| GMN | 34.2 | 55.0 | 46.4 | 39.6 | 77.0 | 60.5 | 46.9 | 54.5 | 31.7 | 51.0 | 48.0 | 48.0 | 48.5 | 50.8 | 28.8 | 73.8 | 49.8 | 38.3 | 69.4 | 83.9 | 51.8 |
| GMN-PL | 38.9 | 56.1 | 47.9 | 41.0 | 79.1 | 66.5 | 49.0 | 57.9 | 33.7 | 54.4 | 43.7 | 49.5 | 53.5 | 55.4 | 31.2 | 76.6 | 53.0 | 37.8 | 71.3 | 86.4 | 54.1 |
| PIA-GM | 43.8 | 60.6 | 51.5 | 43.5 | 75.4 | 70.6 | 58.9 | 62.0 | 35.3 | 54.4 | 44.3 | 57.1 | 56.1 | 58.6 | 40.0 | 76.5 | 60.1 | 36.5 | 76.1 | 86.3 | 57.4 |
| PCA-GM | 44.6 | 63.6 | 53.7 | 45.9 | 78.0 | 69.5 | 52.7 | 63.1 | 37.6 | 56.4 | 44.4 | 58.3 | 56.2 | 57.5 | 39.0 | 80.1 | 59.6 | 40.2 | 69.4 | 87.1 | 57.8 |
| IPCA-GM | 44.5 | 63.9 | 54.6 | 47.6 | 79.9 | 69.8 | 54.7 | 64.4 | 37.9 | 59.4 | 55.6 | 57.5 | 57.5 | 57.4 | 40.2 | 80.1 | 60.0 | 41.2 | 71.4 | 86.9 | 59.2 |
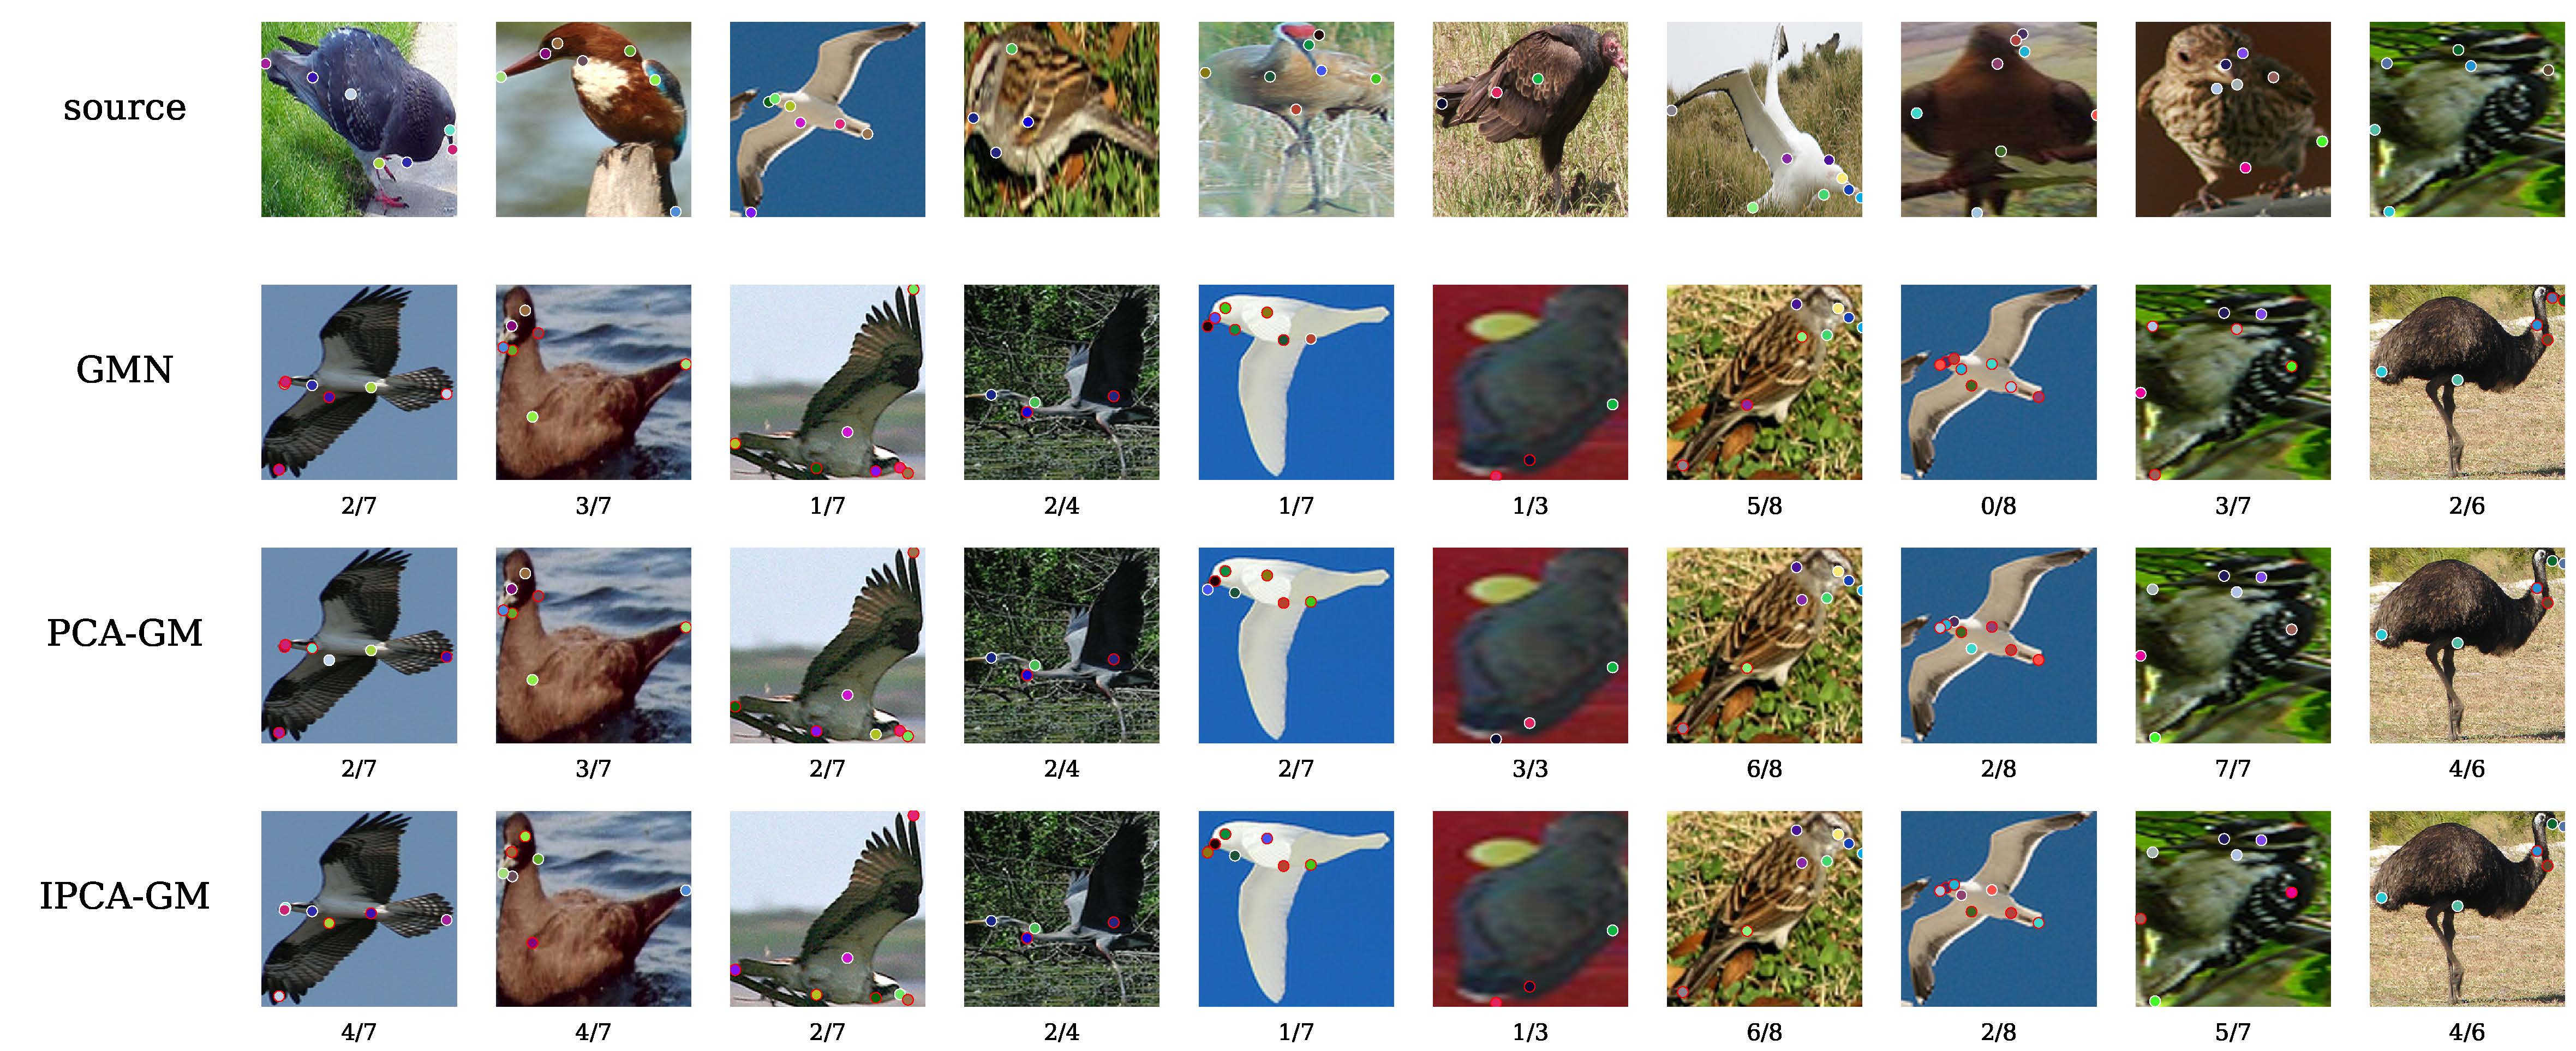
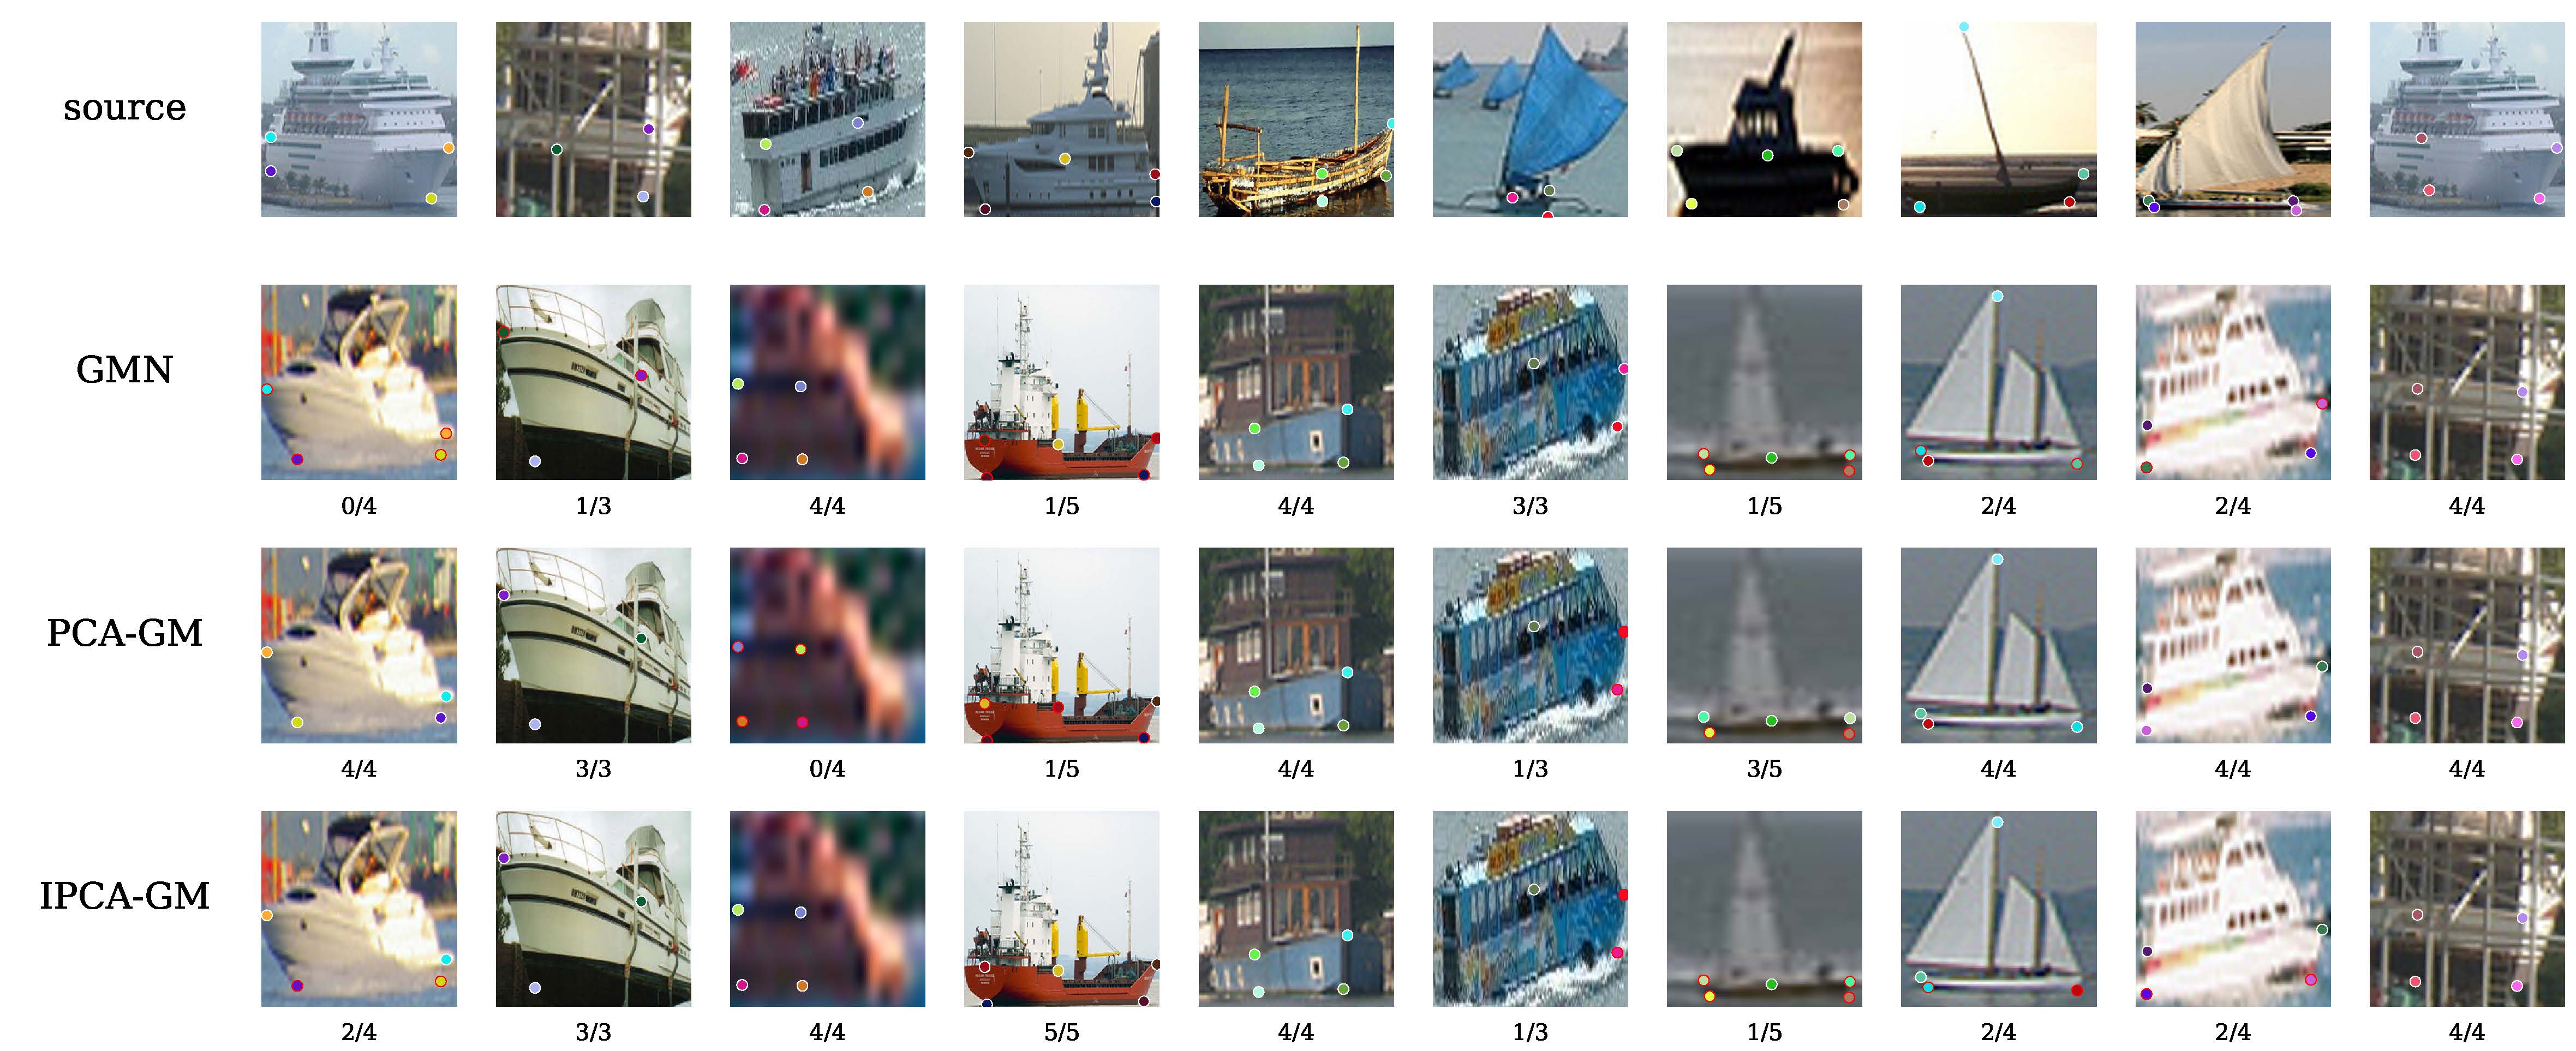
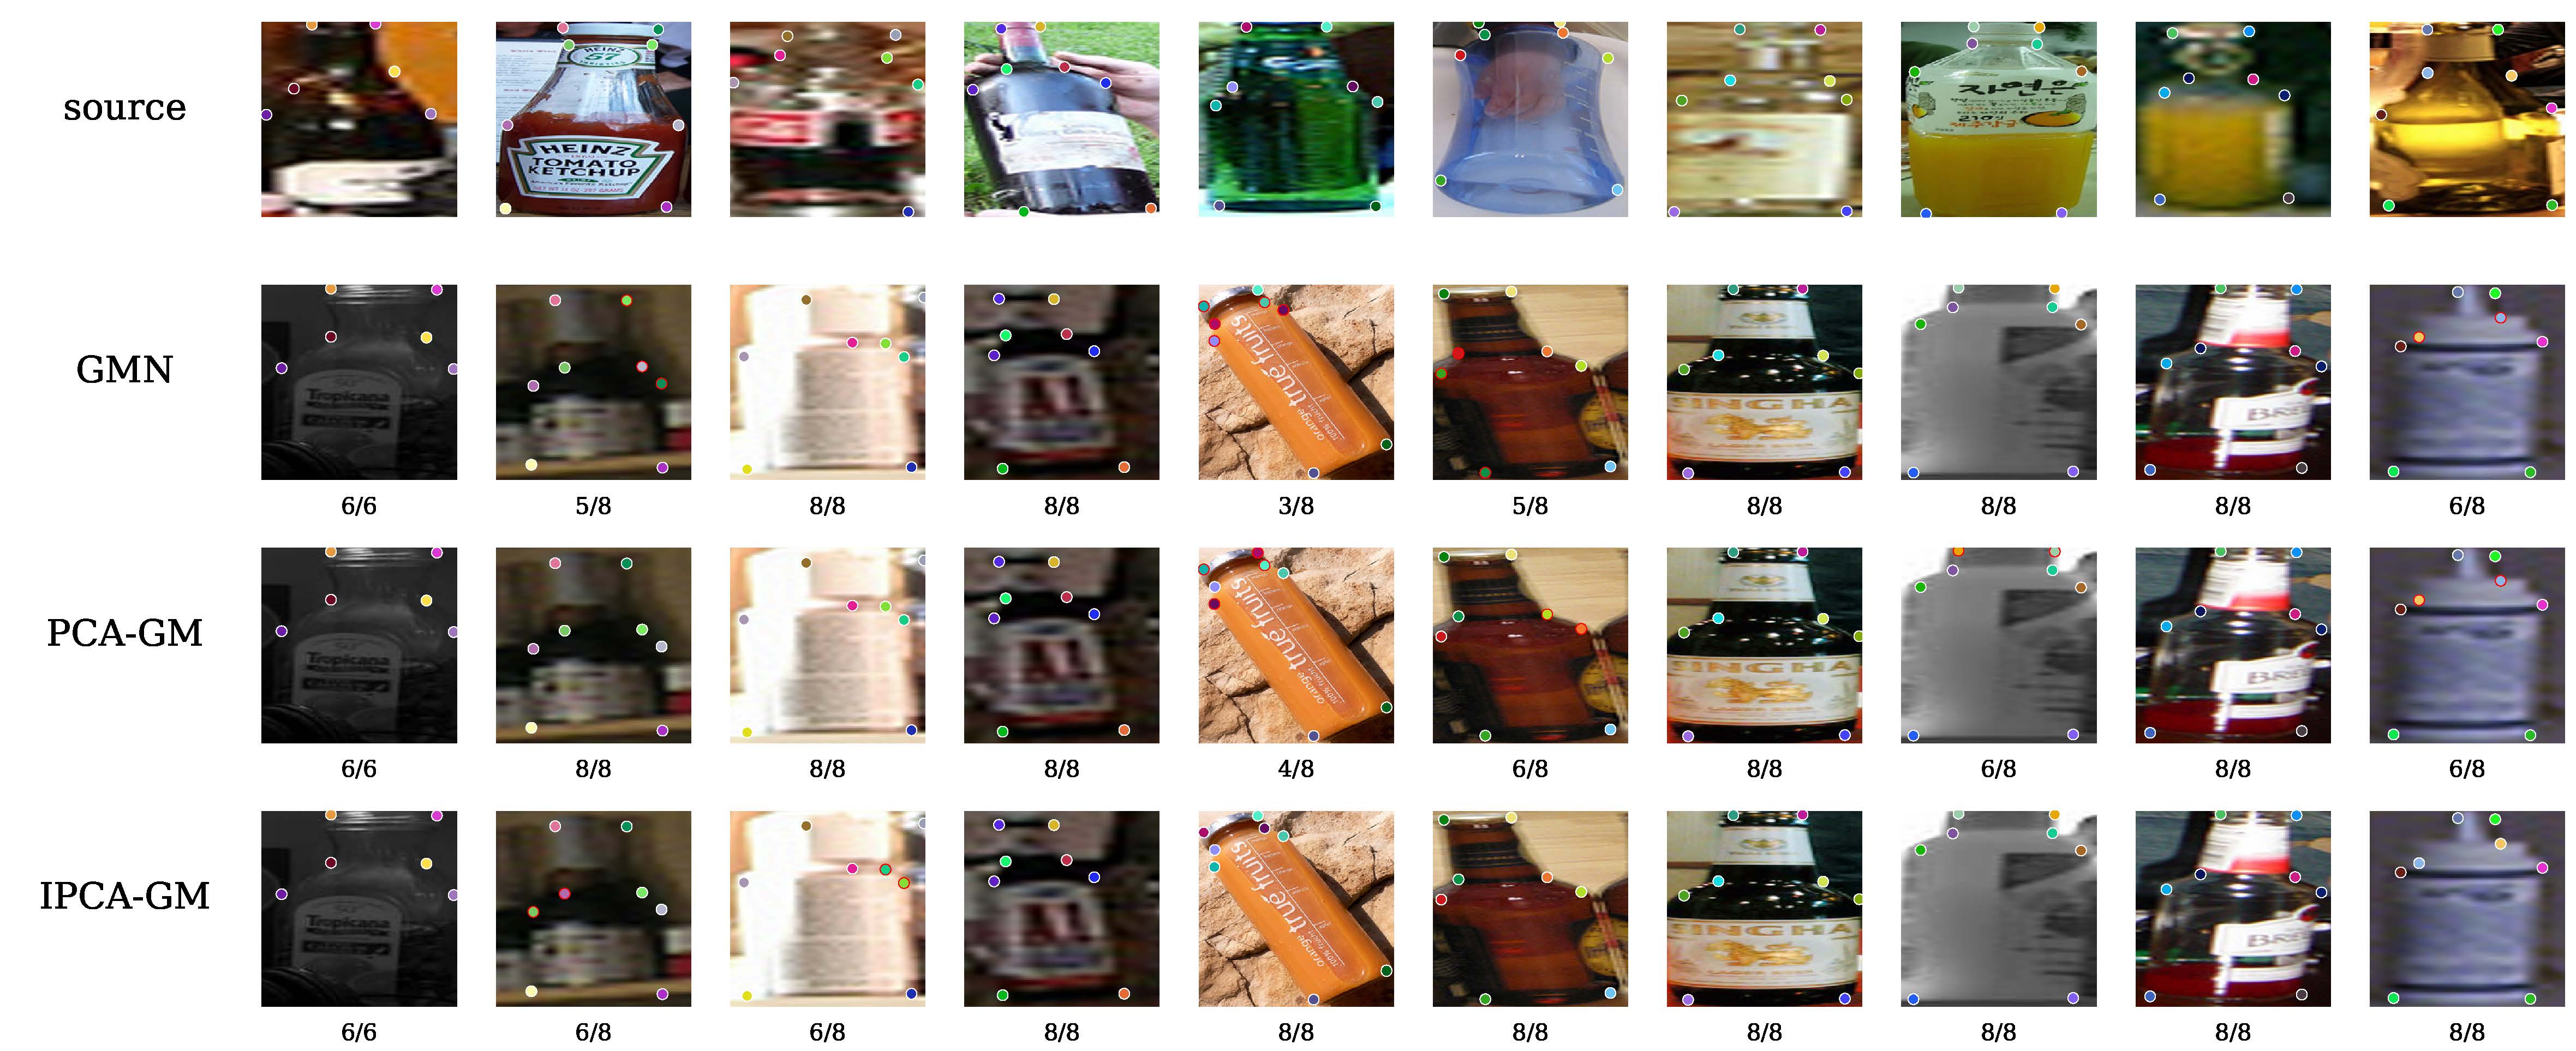
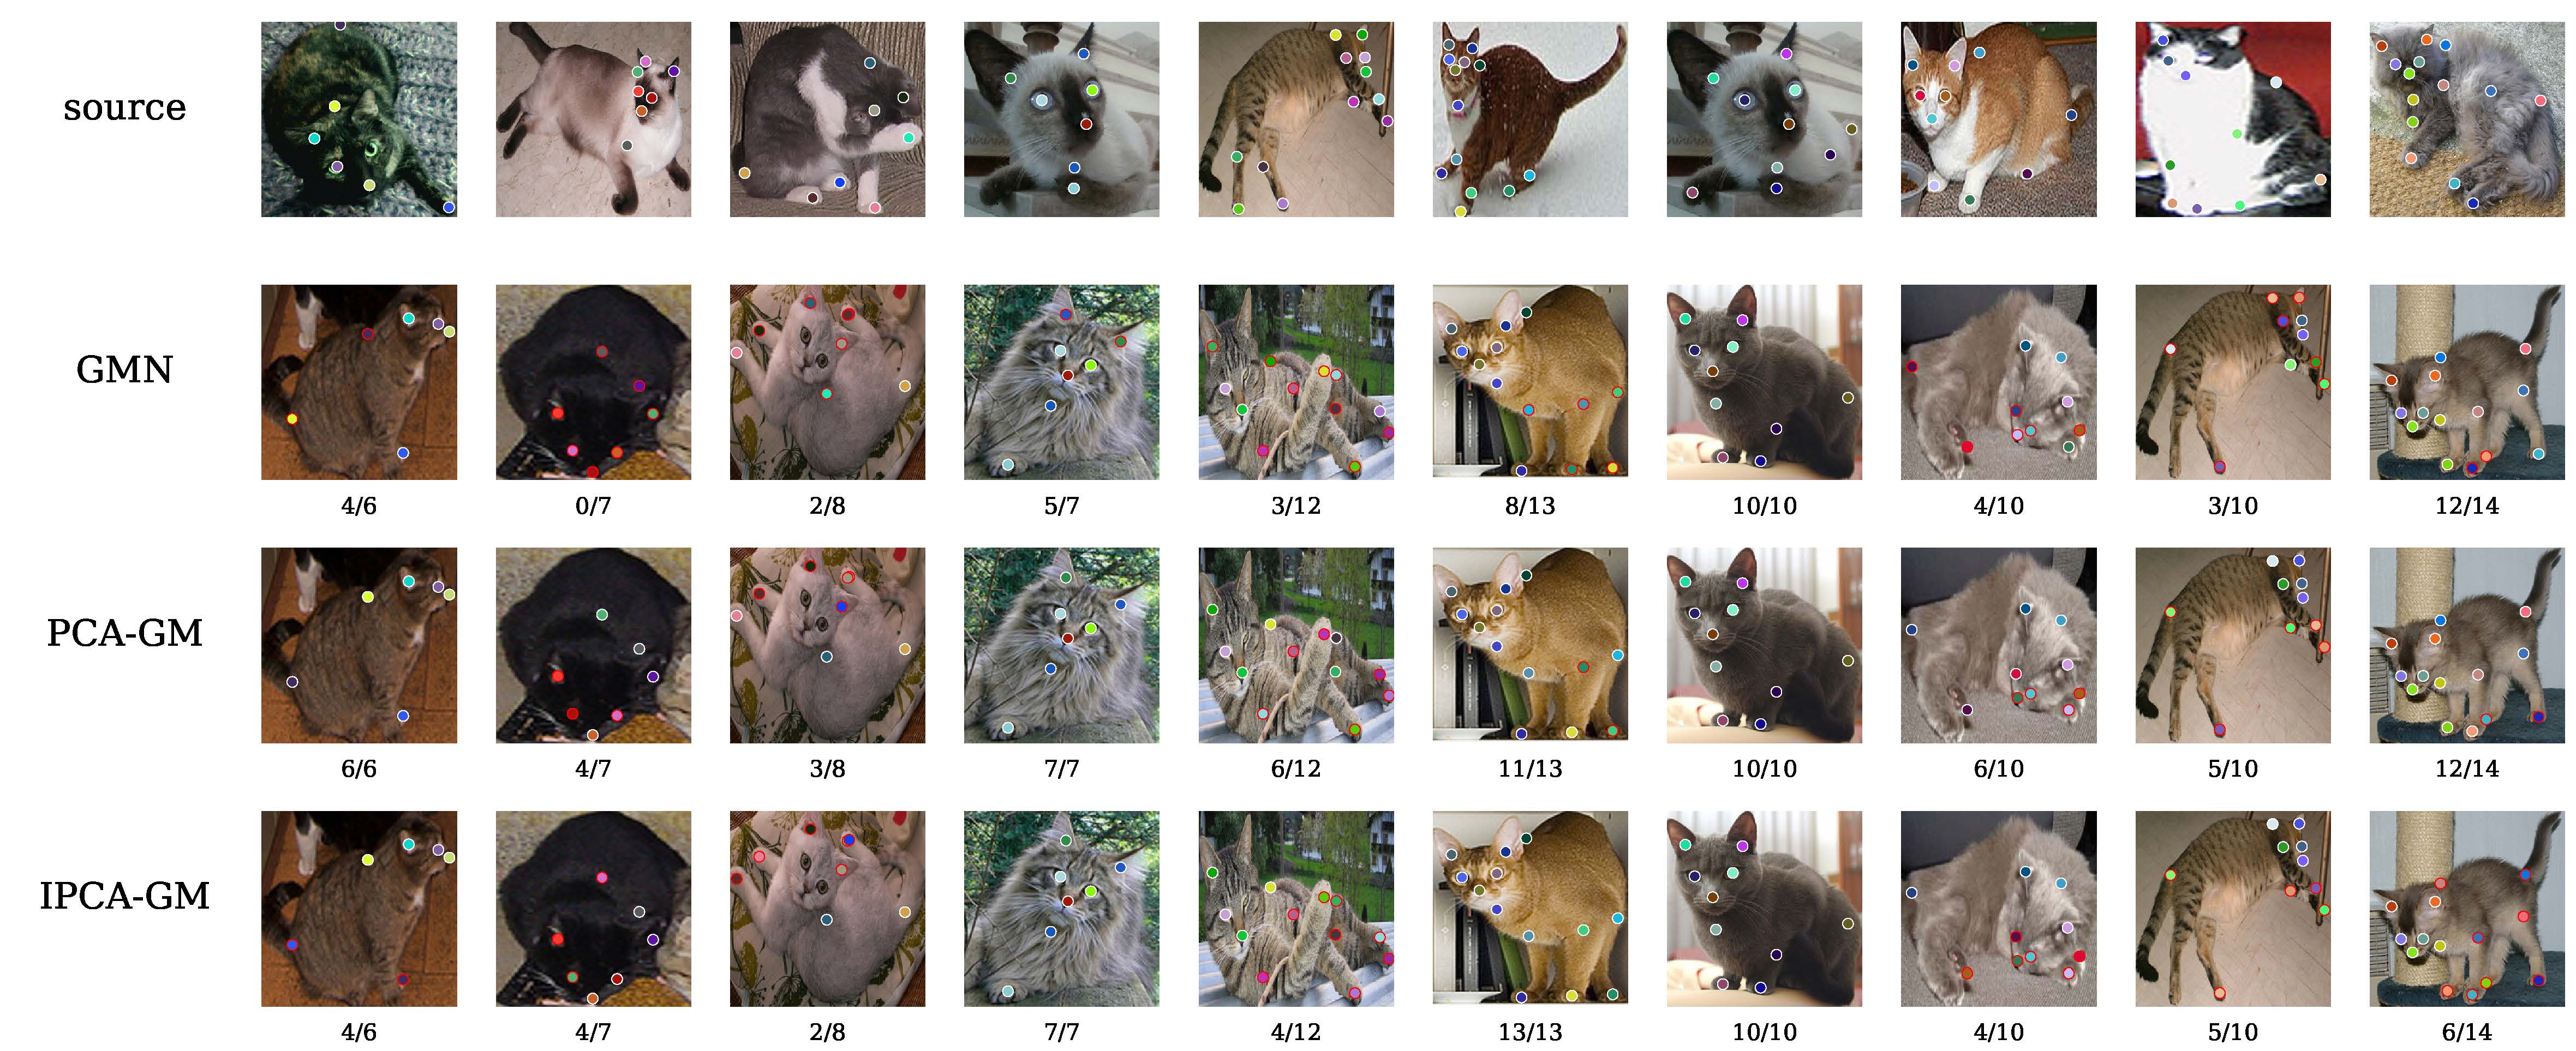
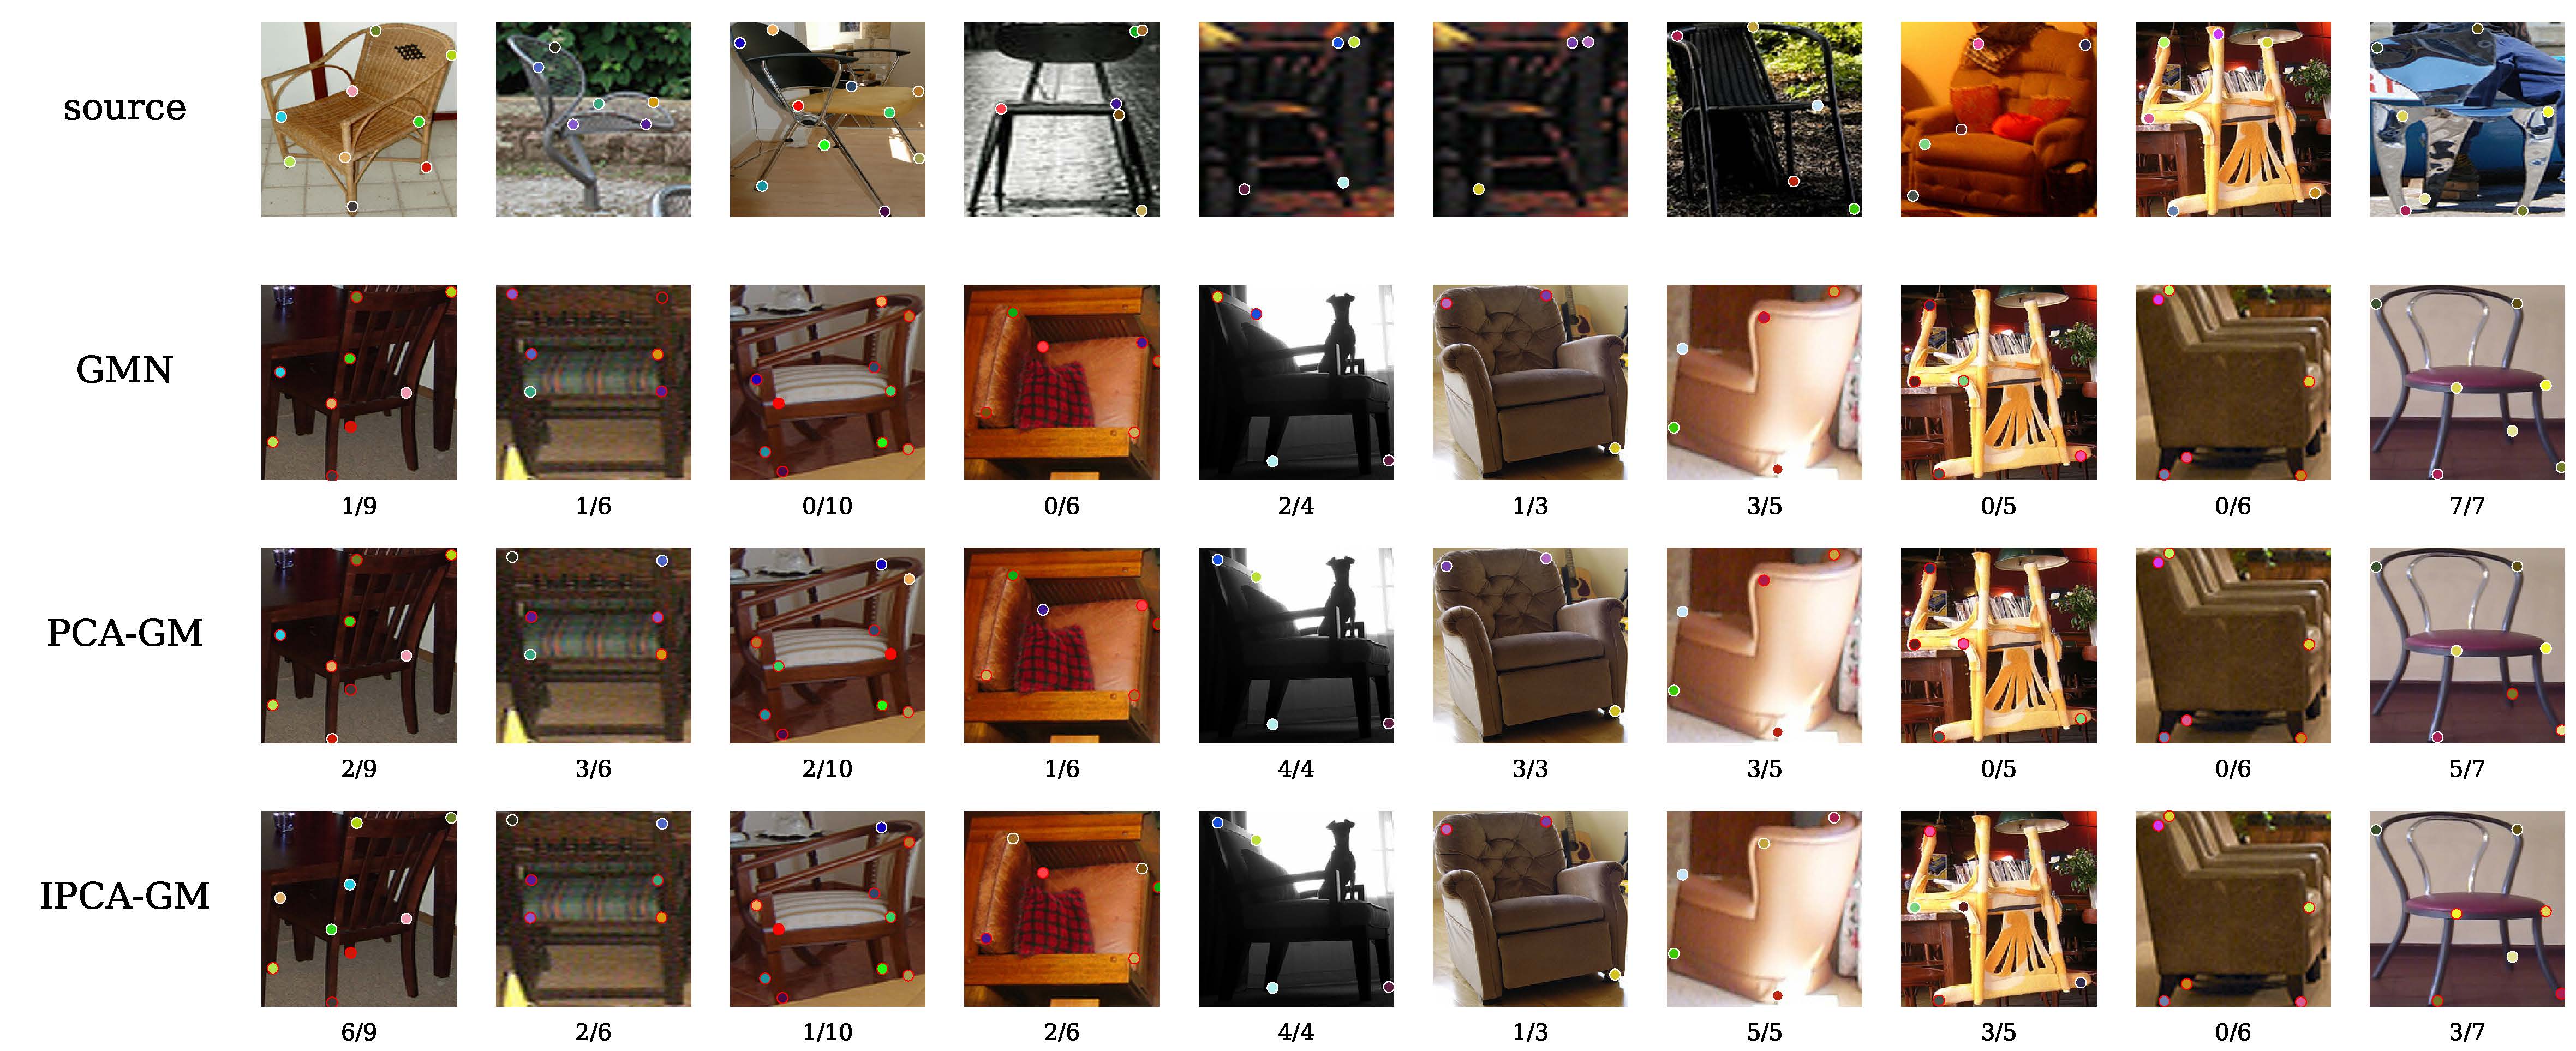
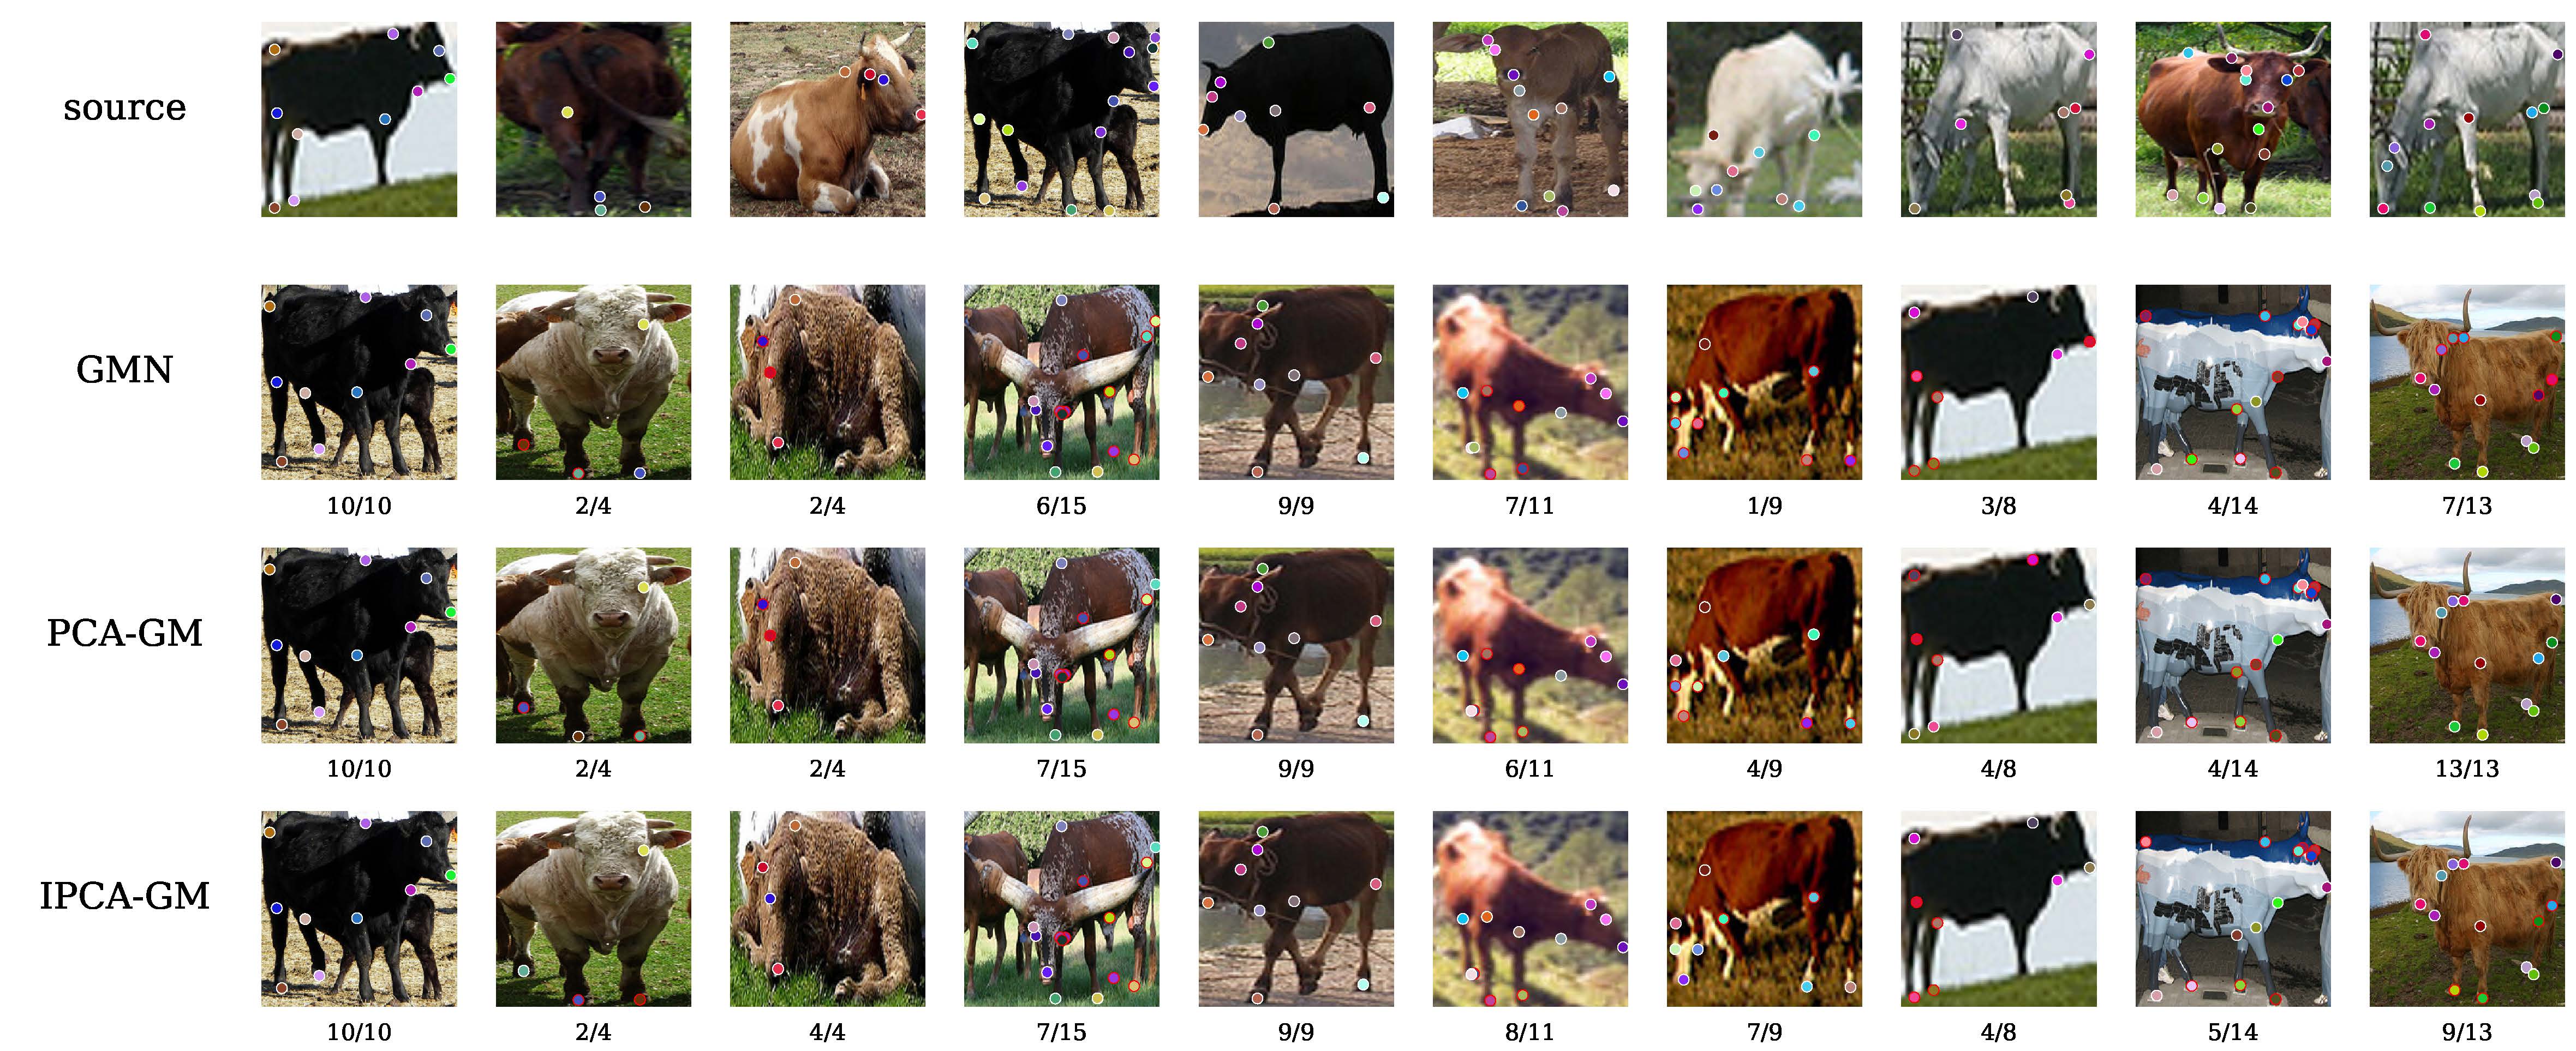
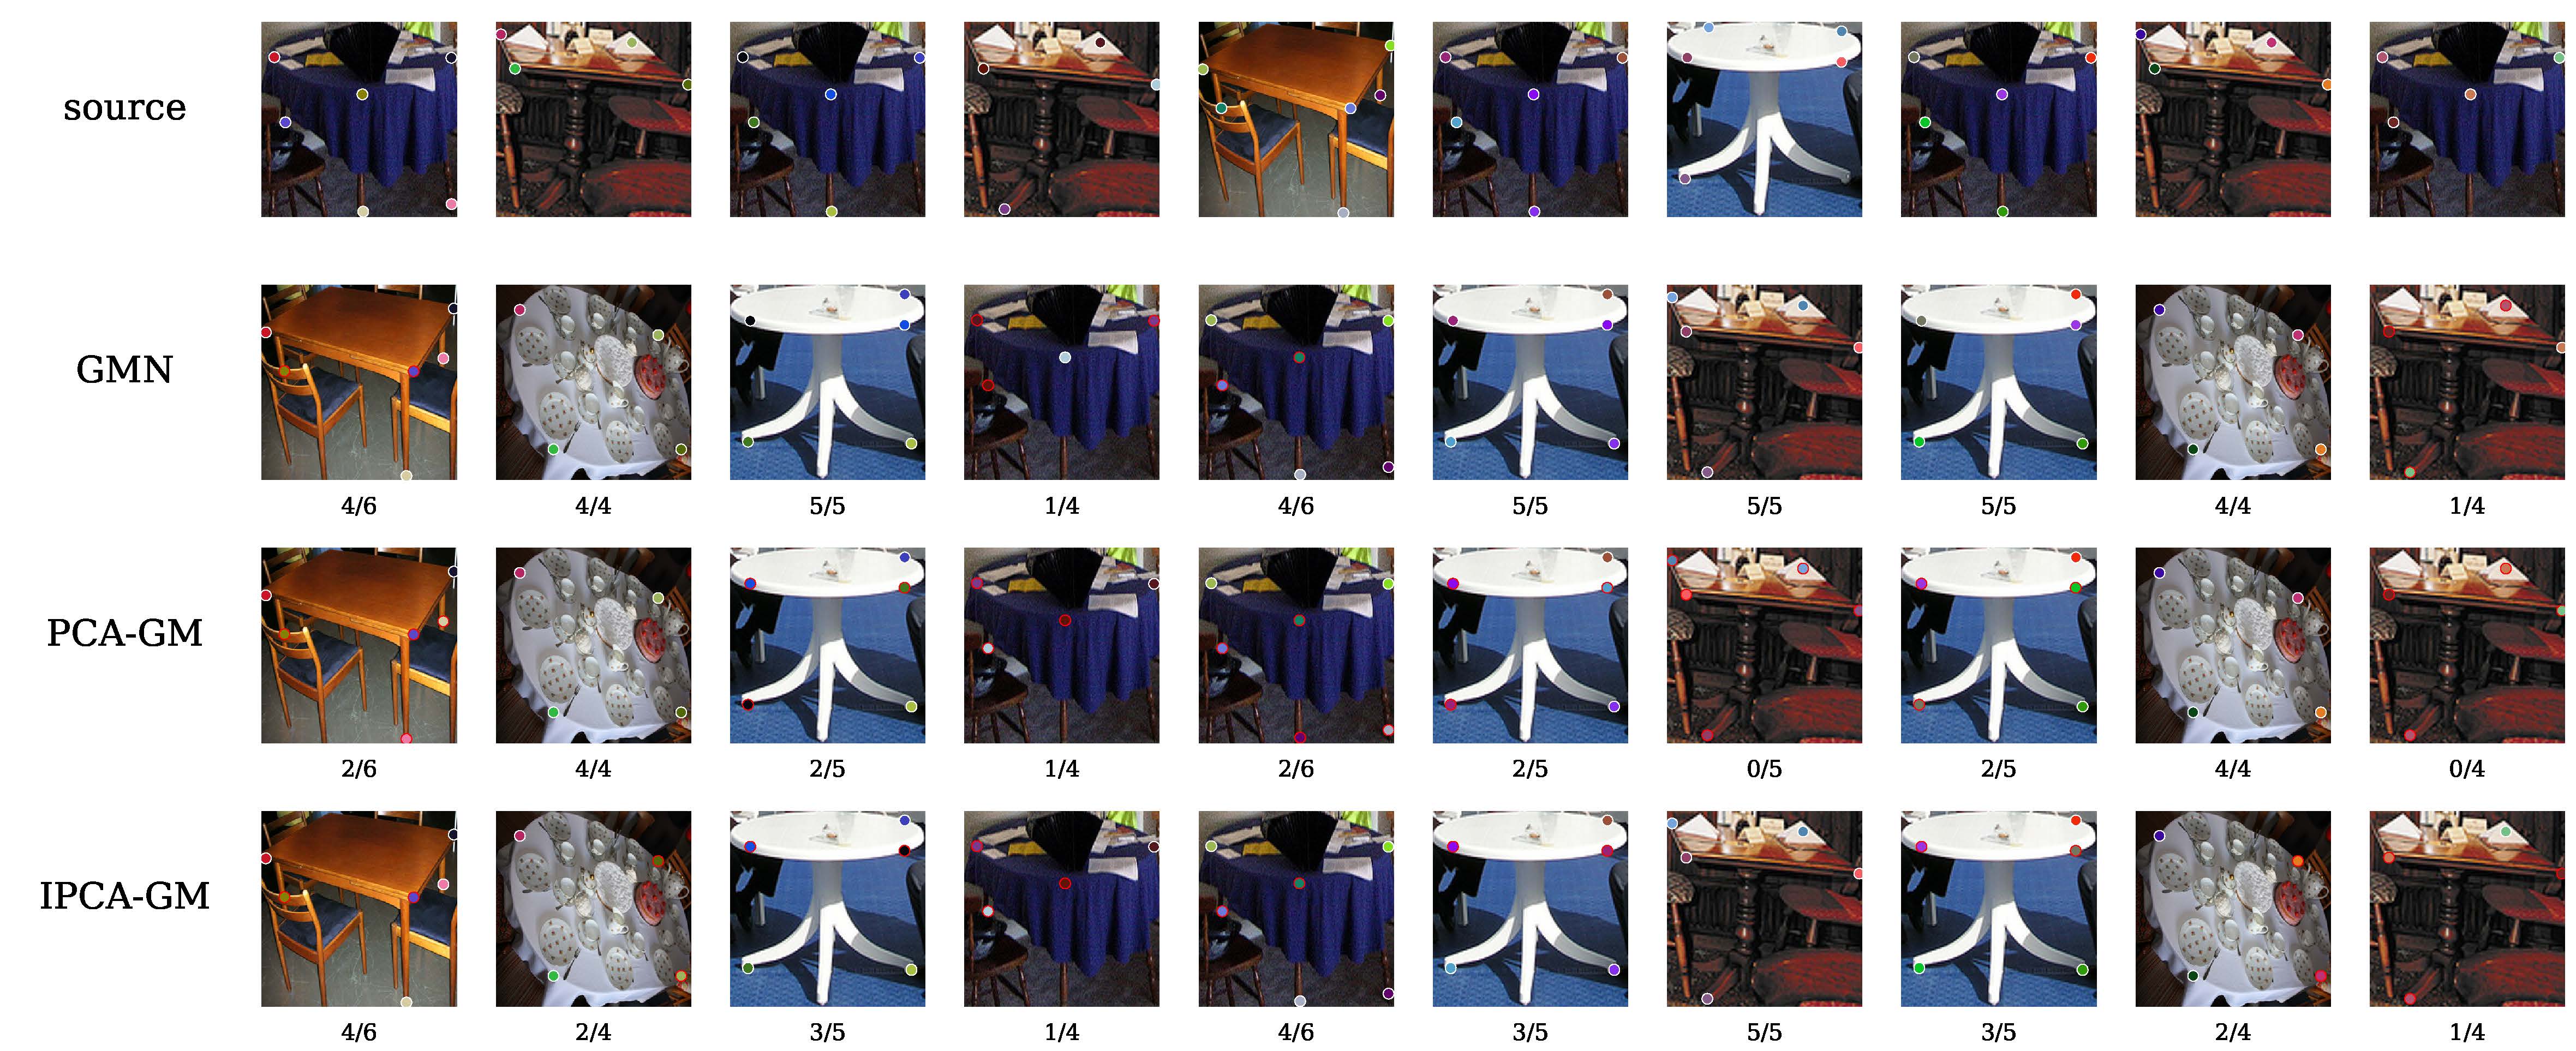
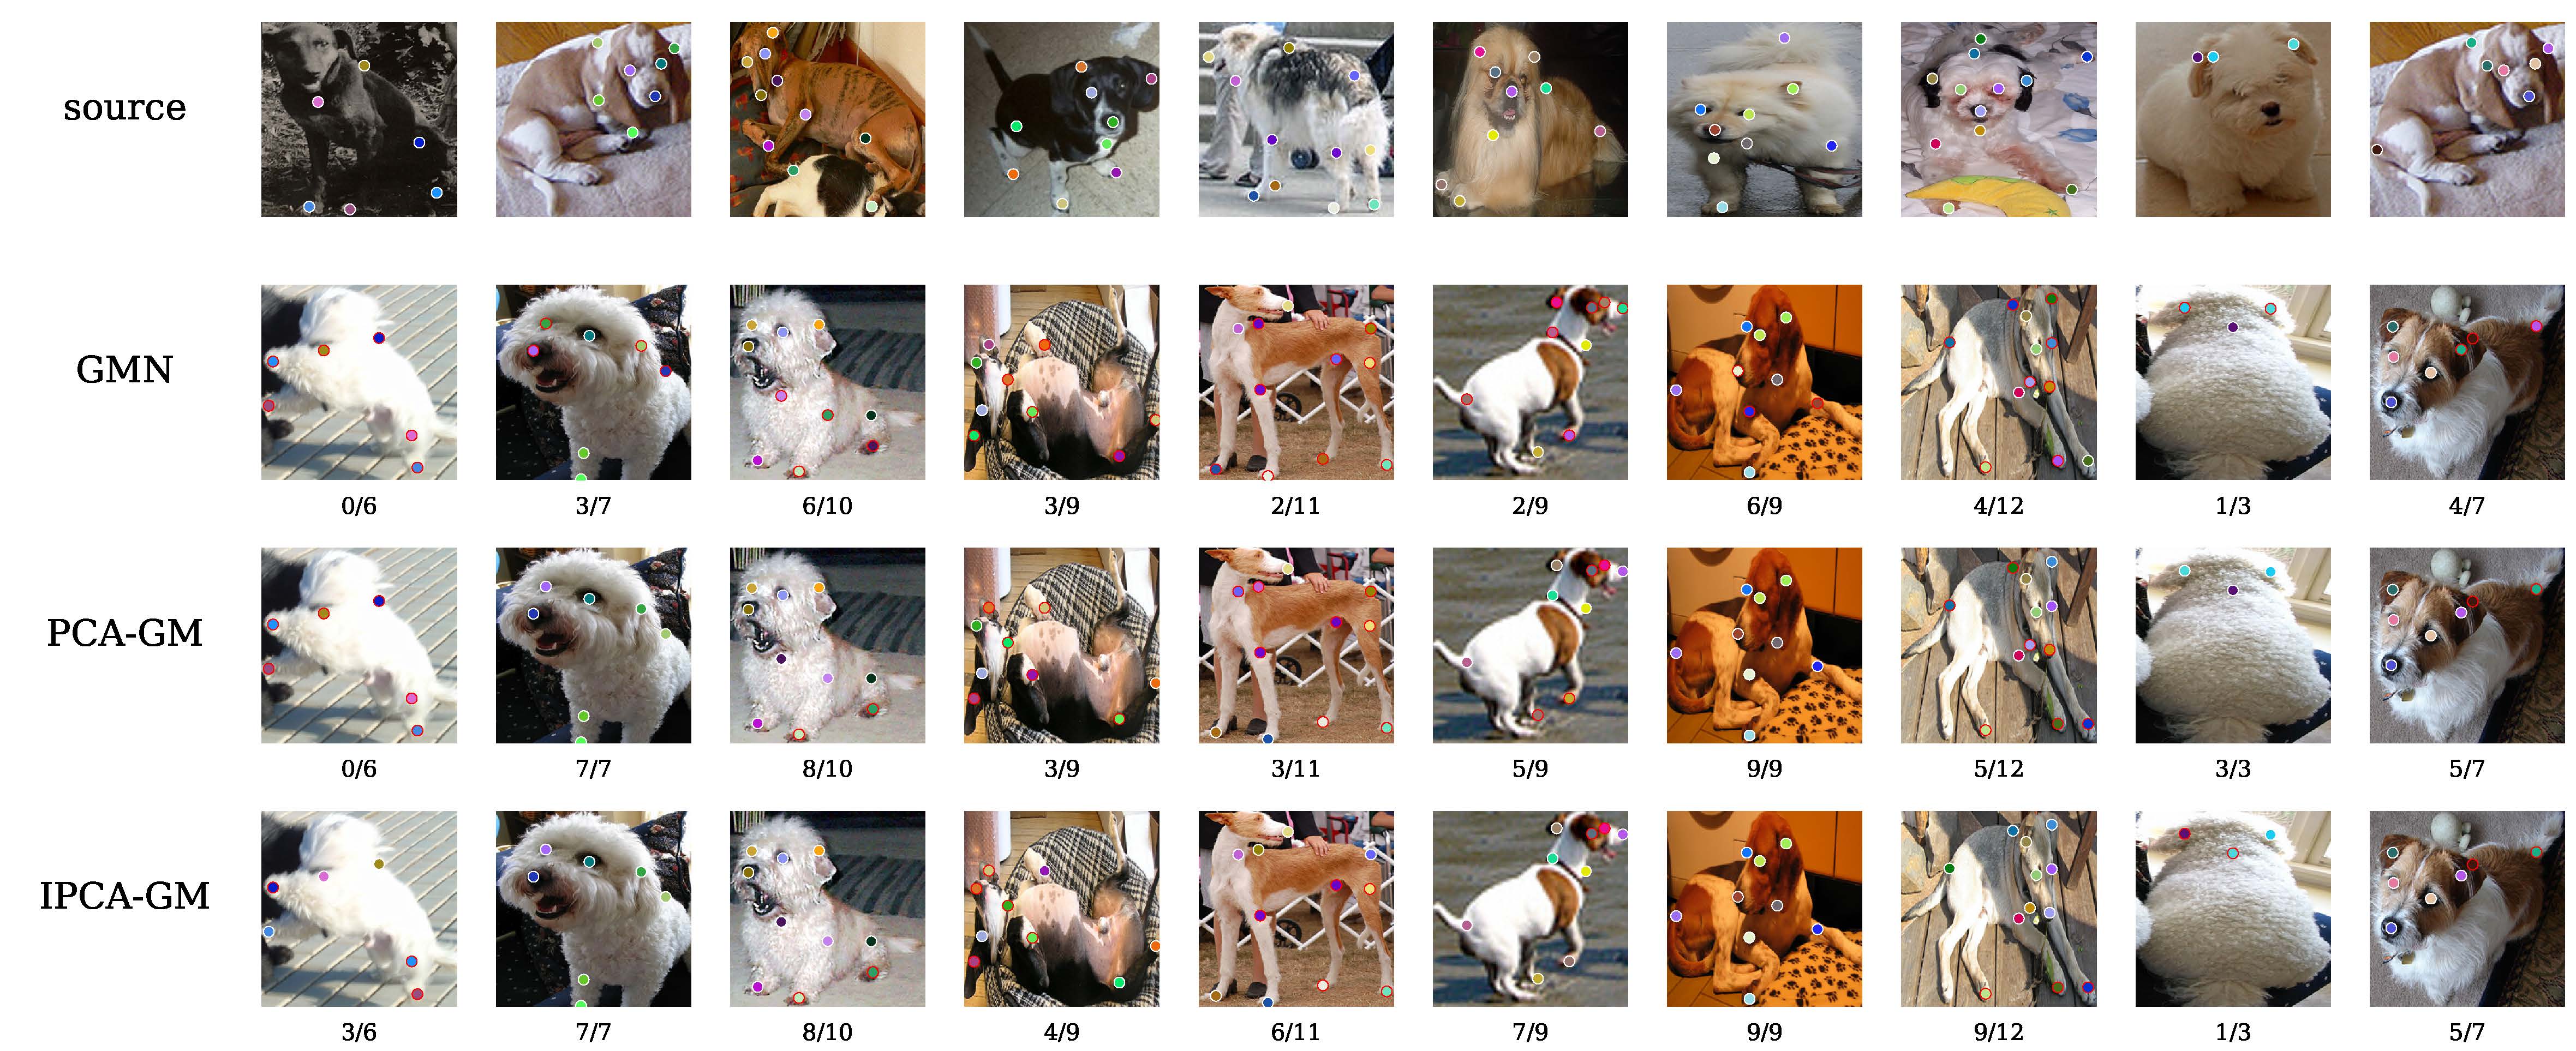
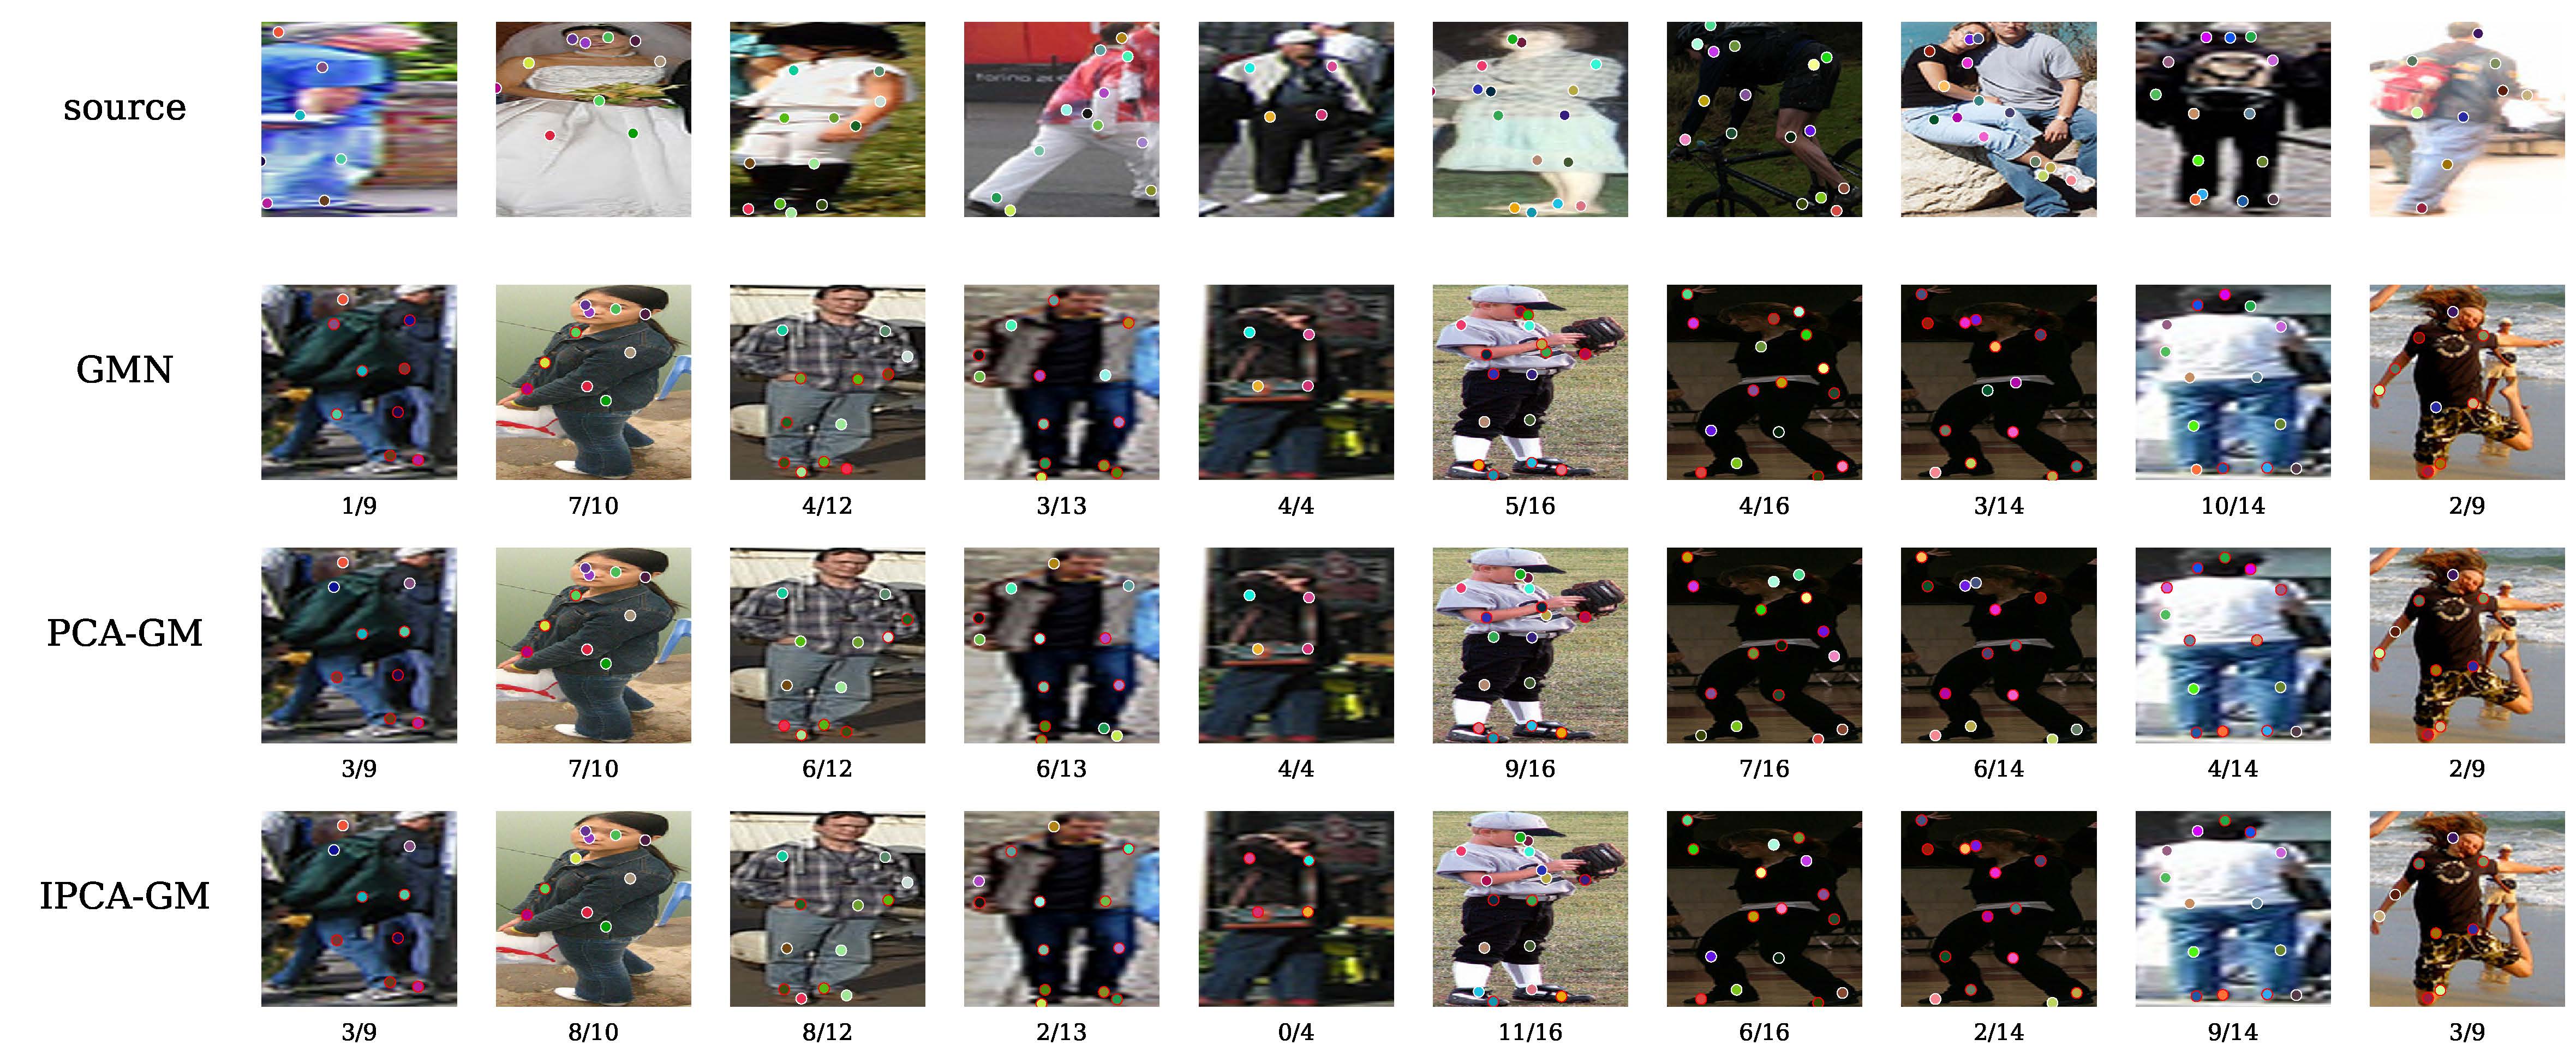
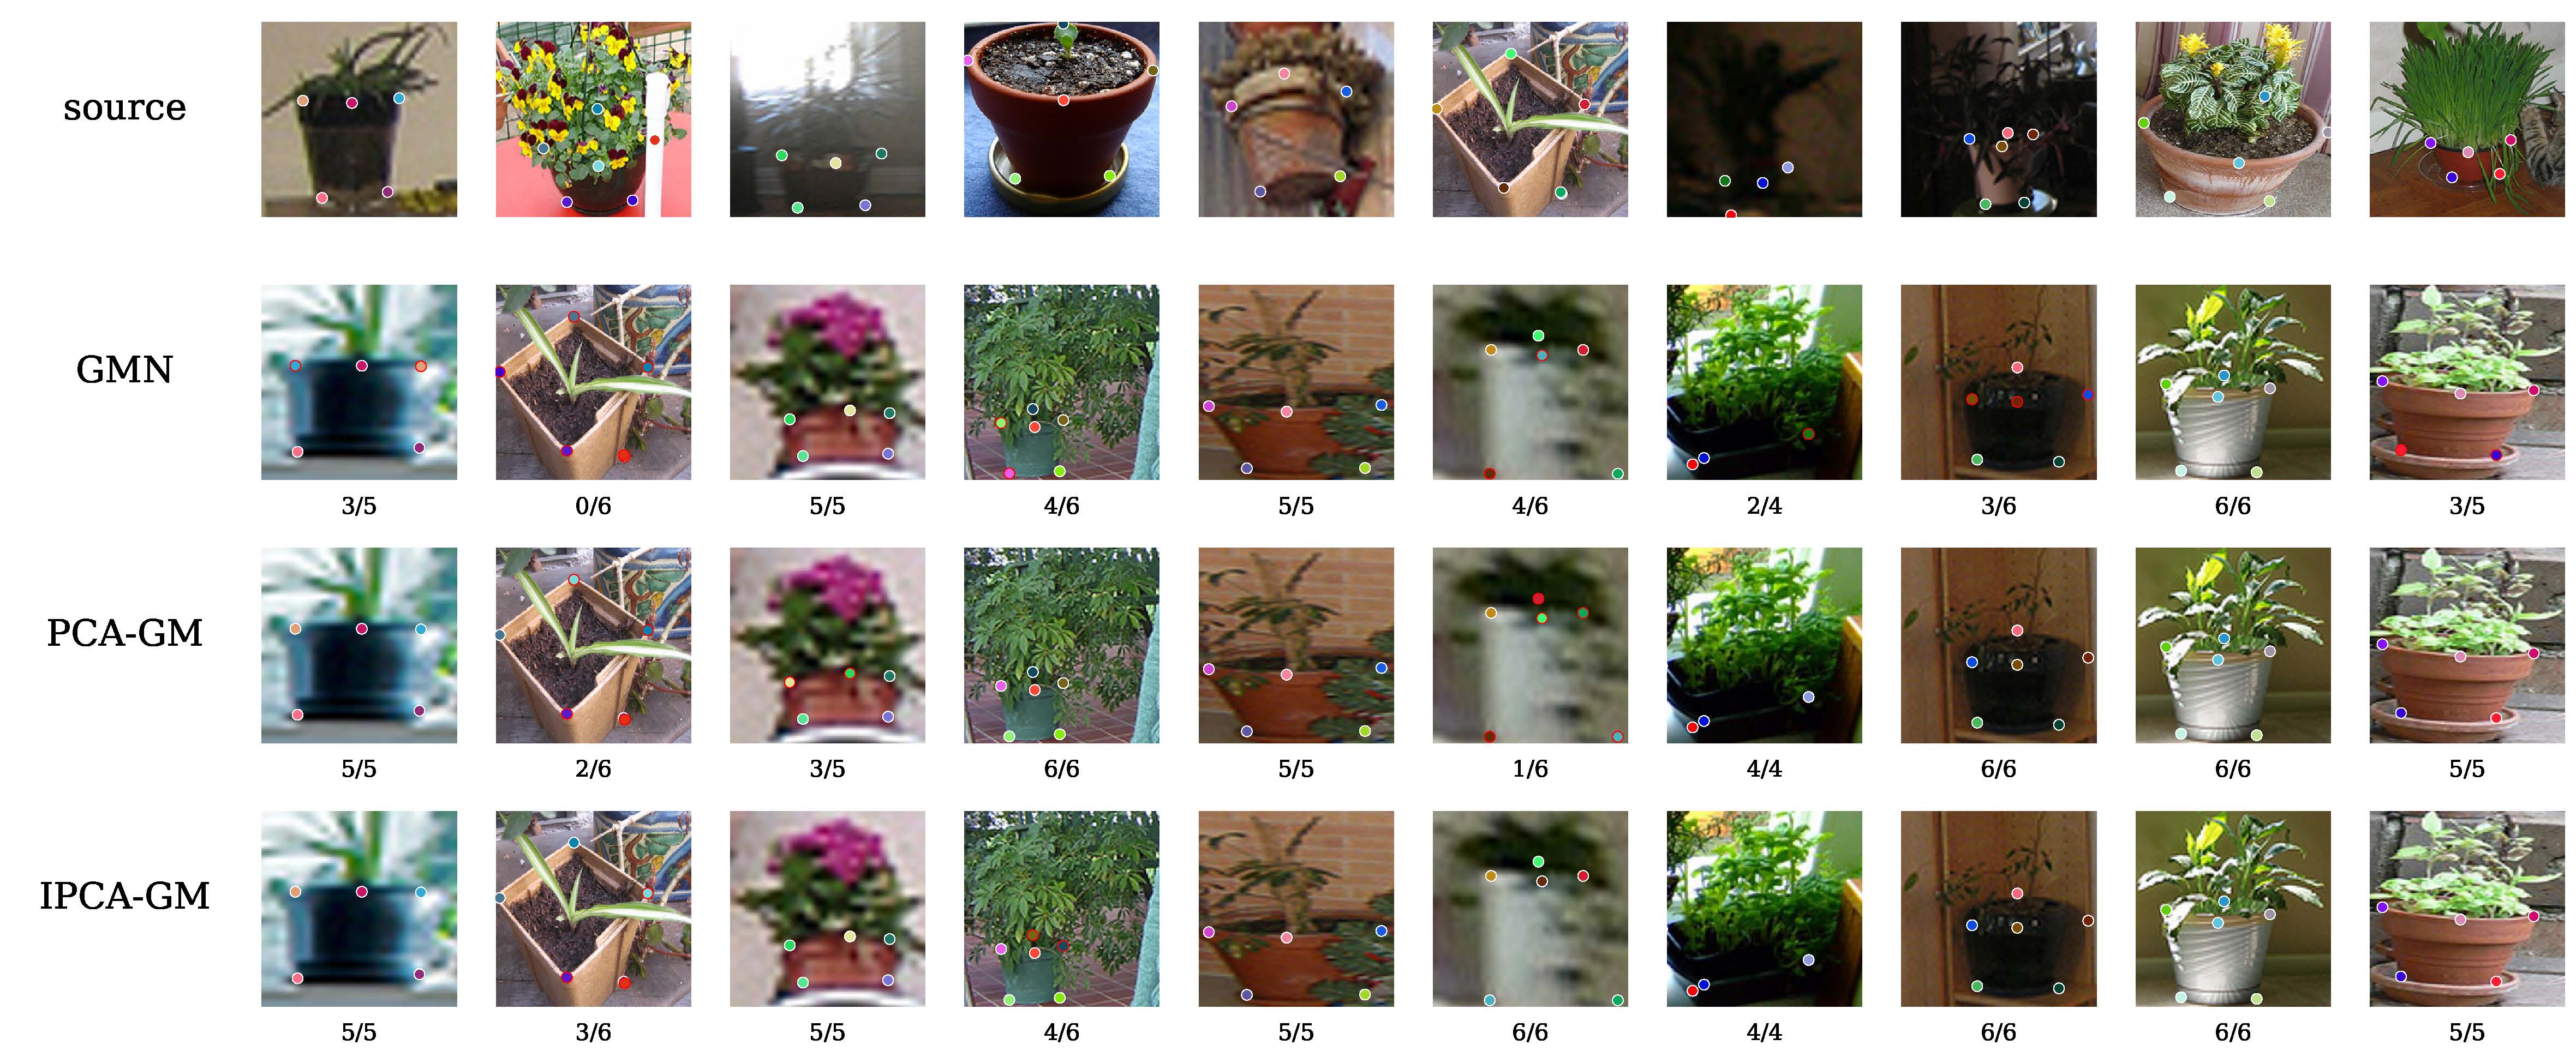
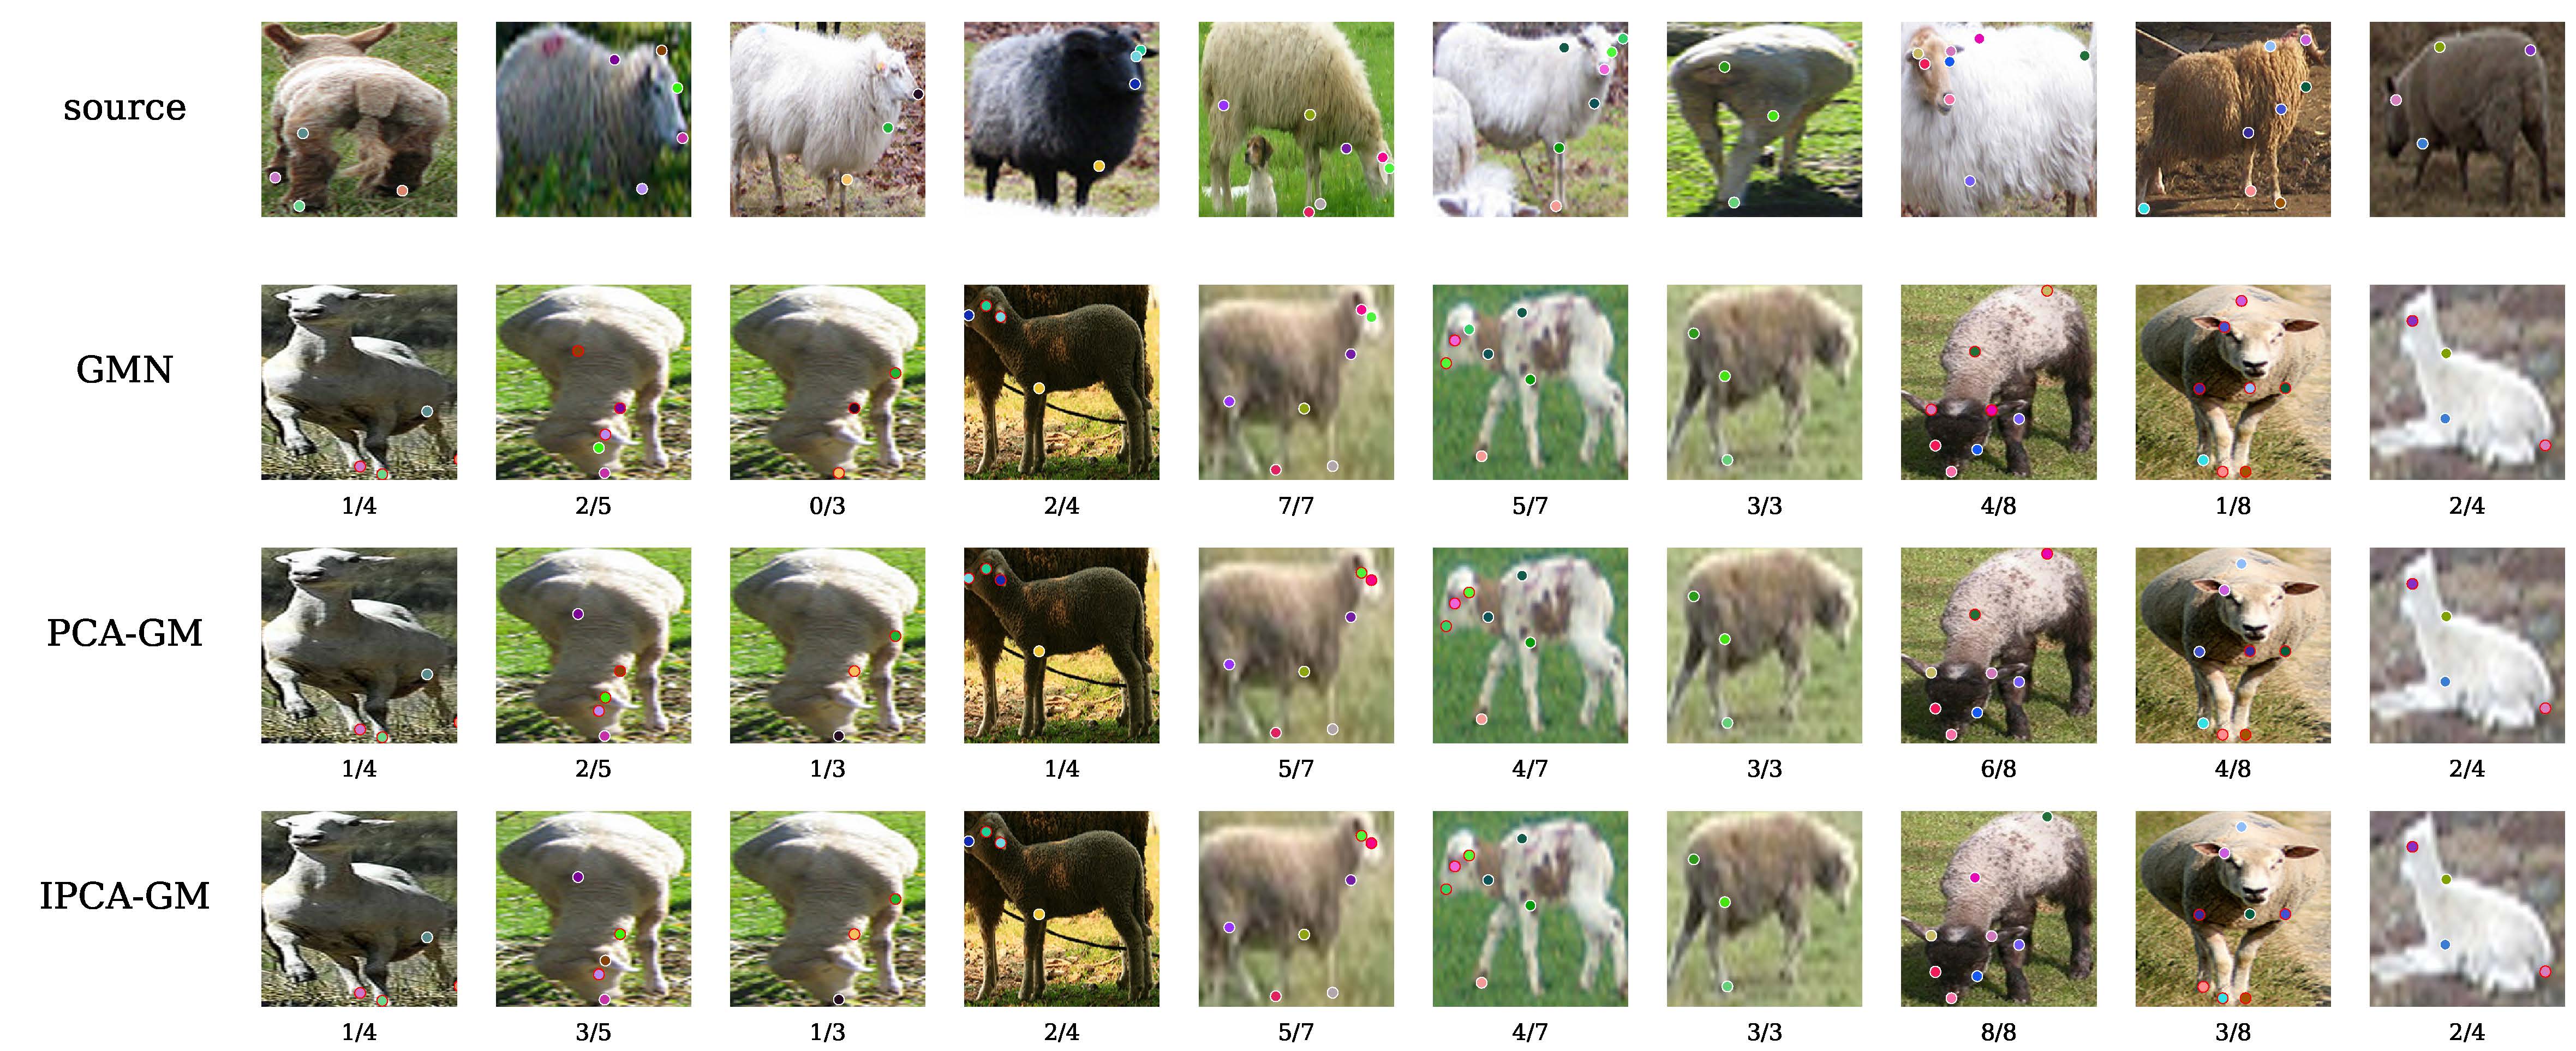
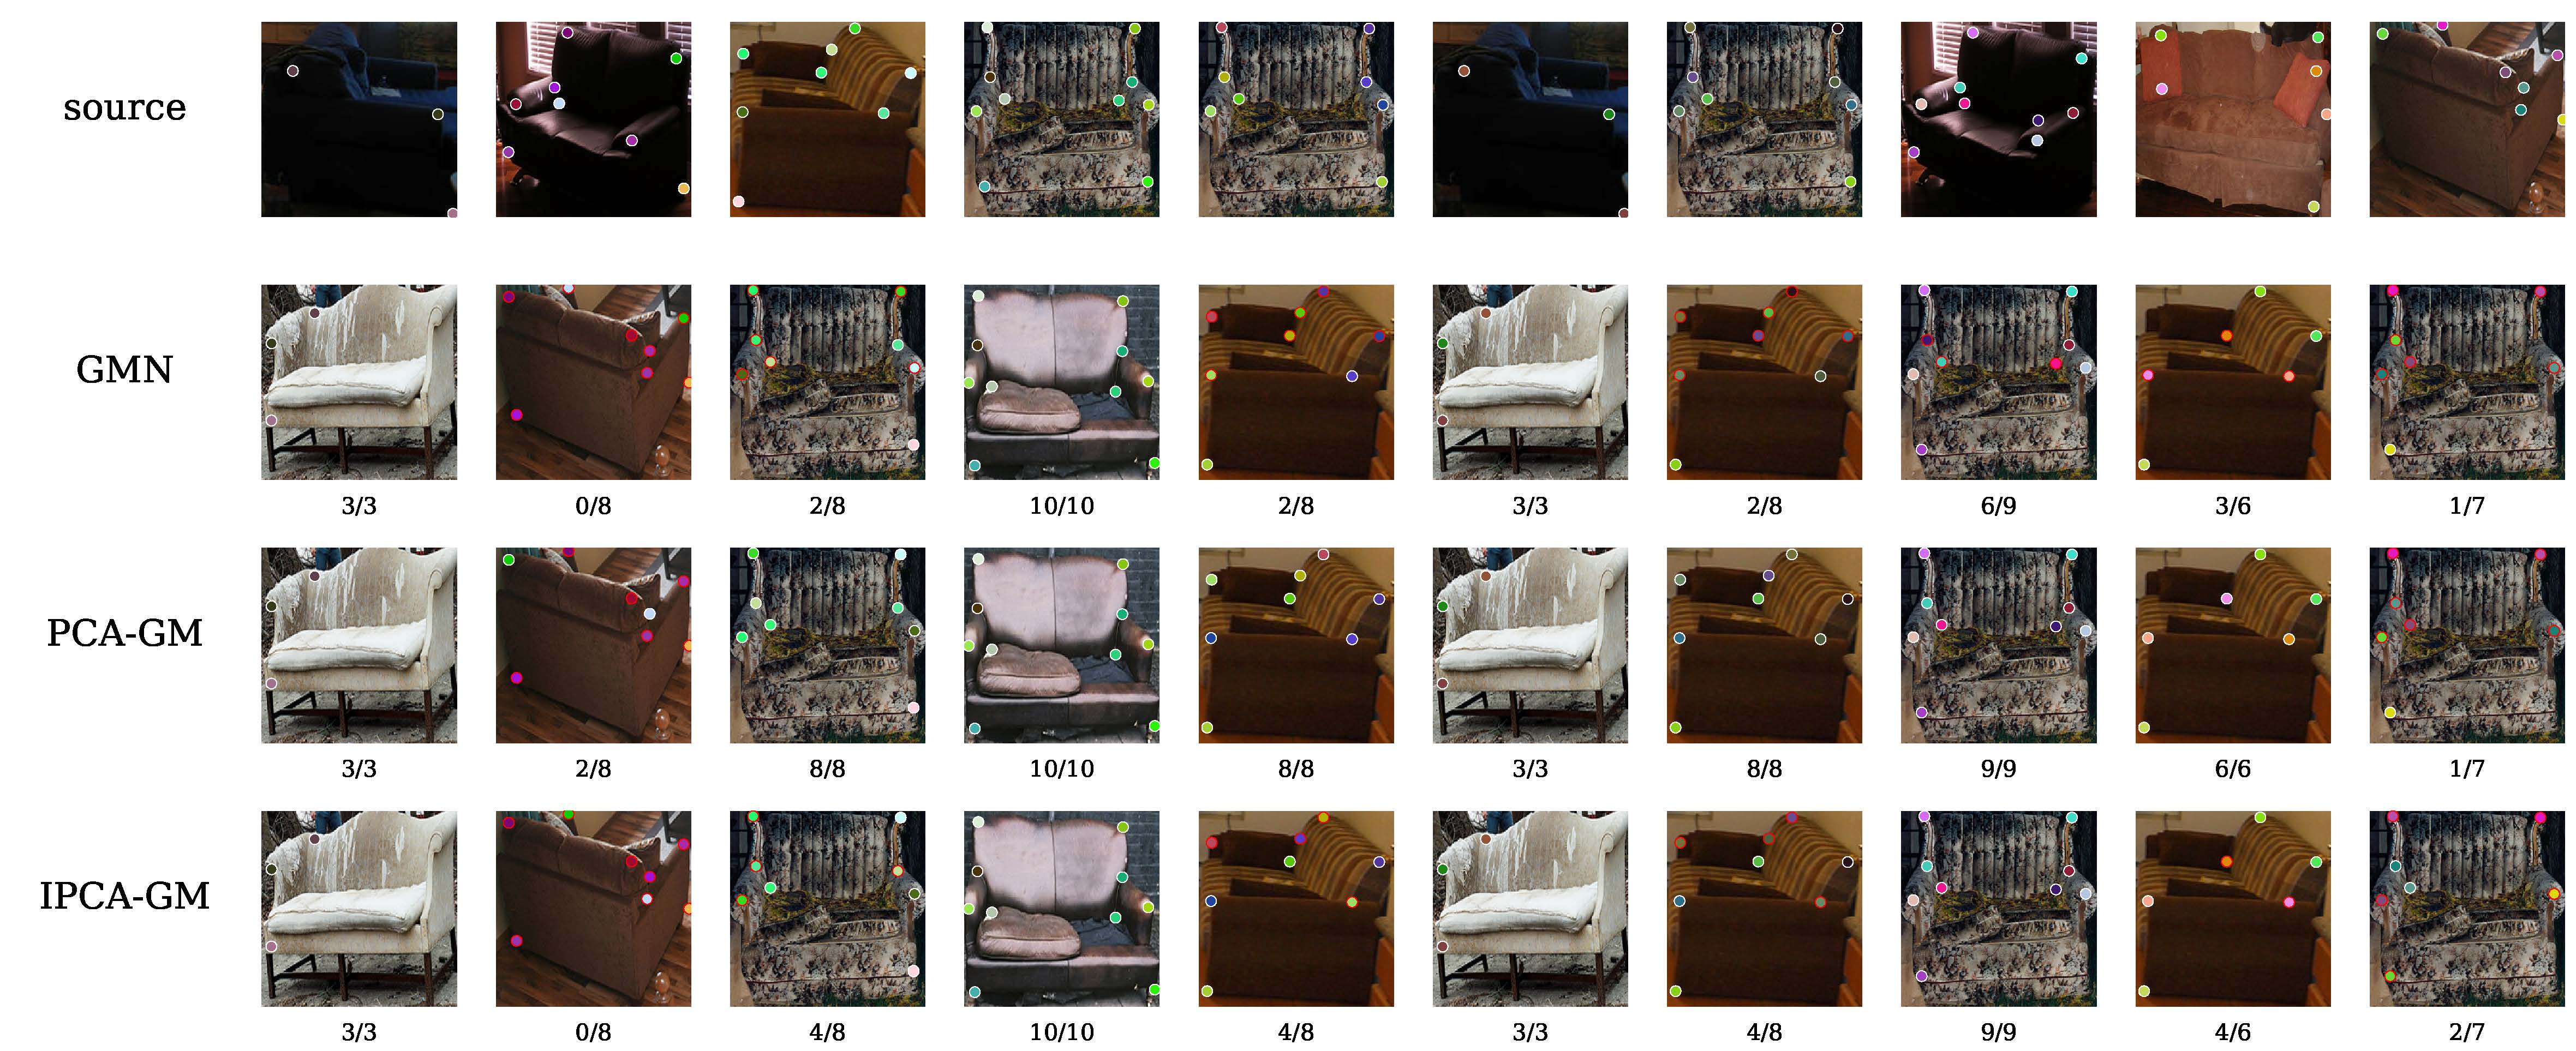
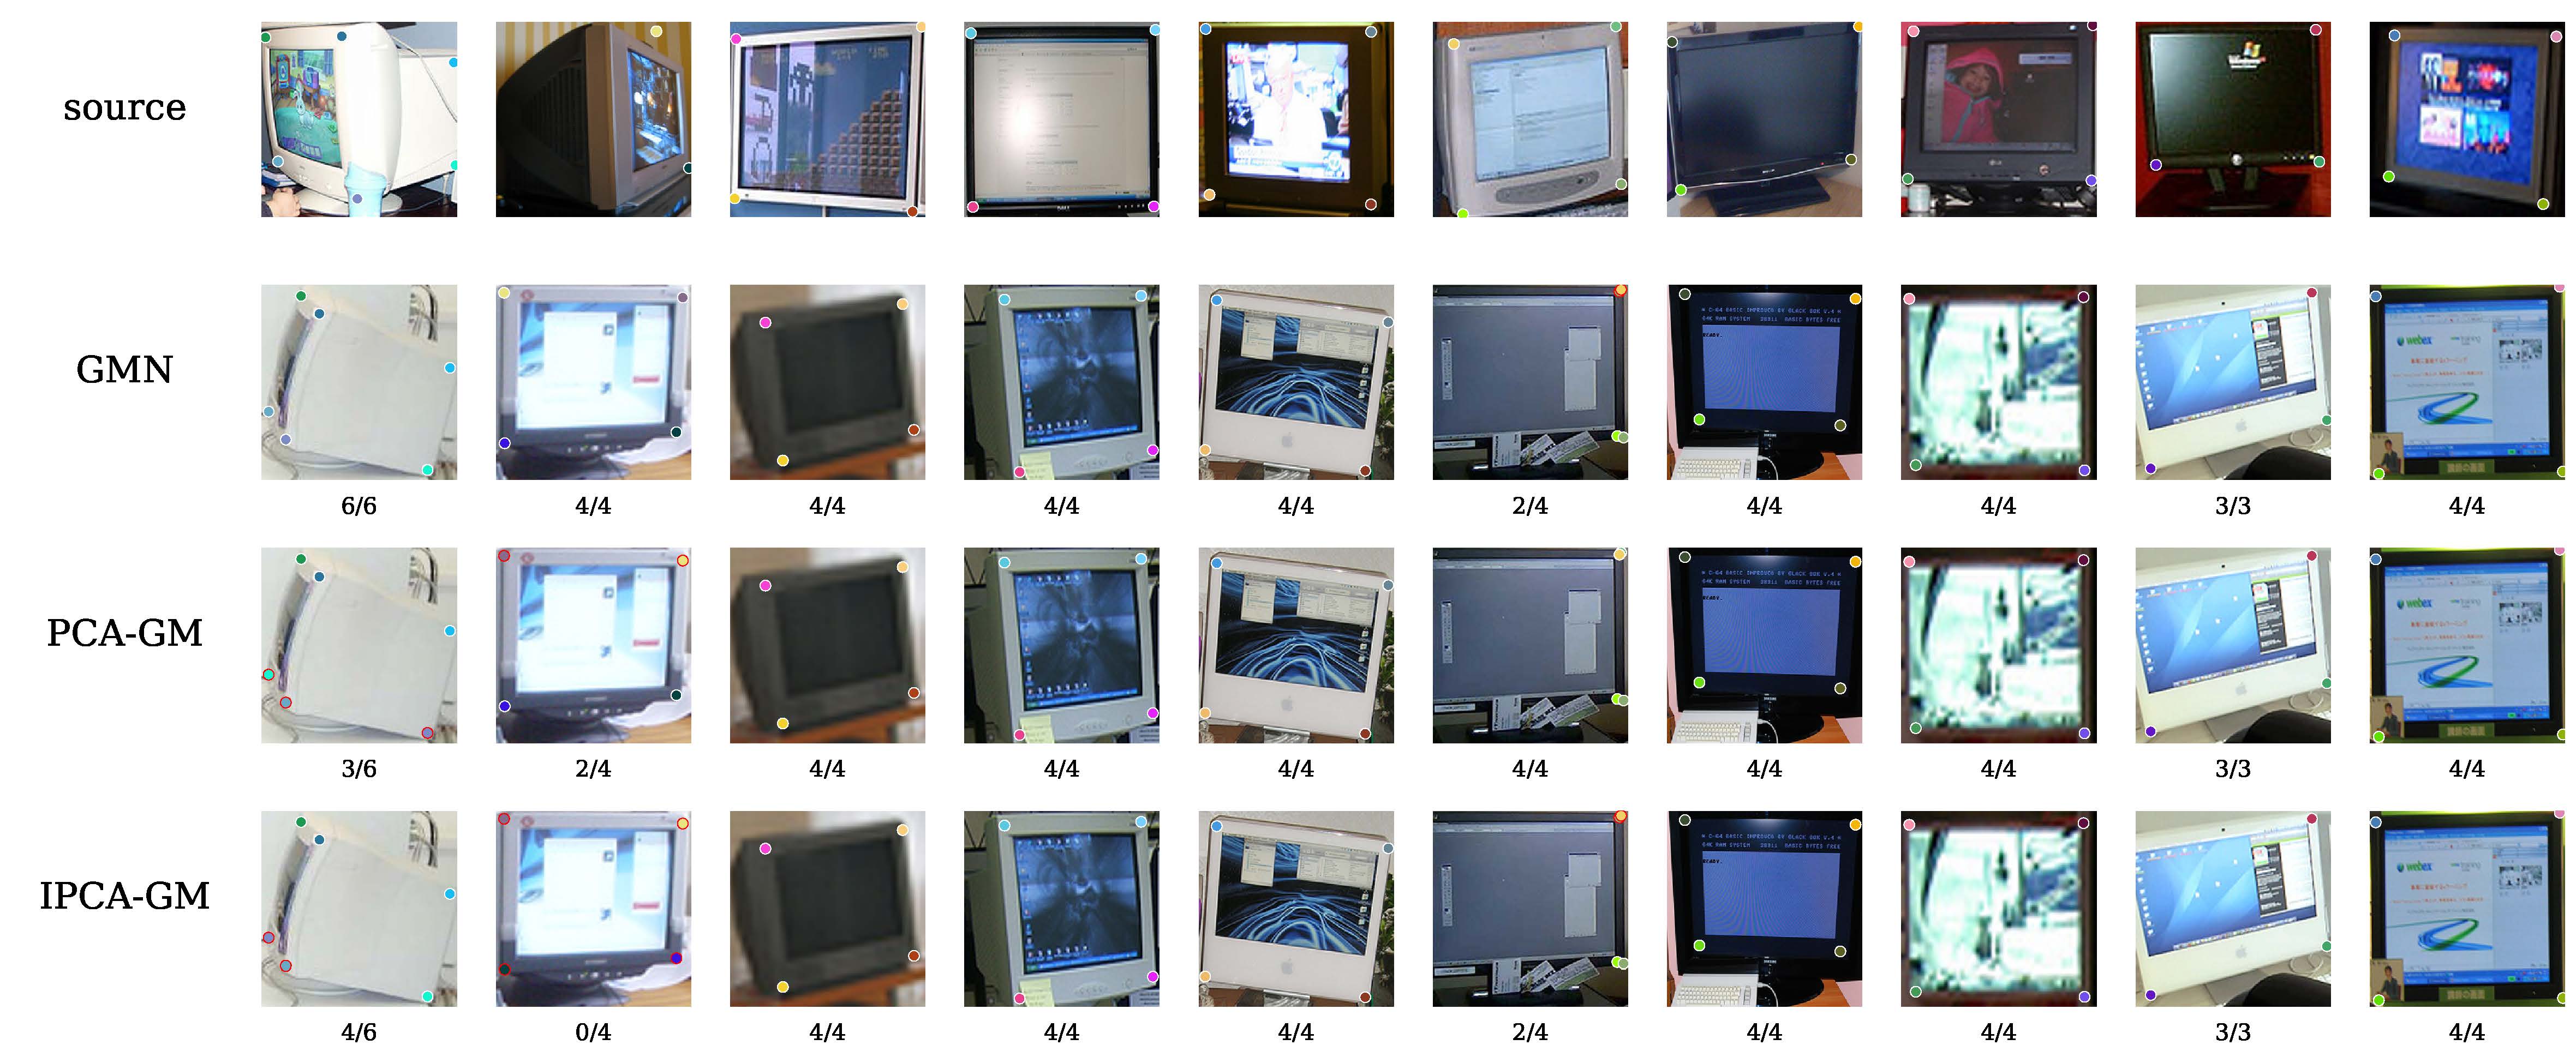
Visualization
Visualization result is provided on the testing set of 20 VOC categories.
Keypoints with the same color stands for predicted correspondence. And the white outer color means correct prediction, while the red outer color means incorrect prediction. (Click the image to zoom in)